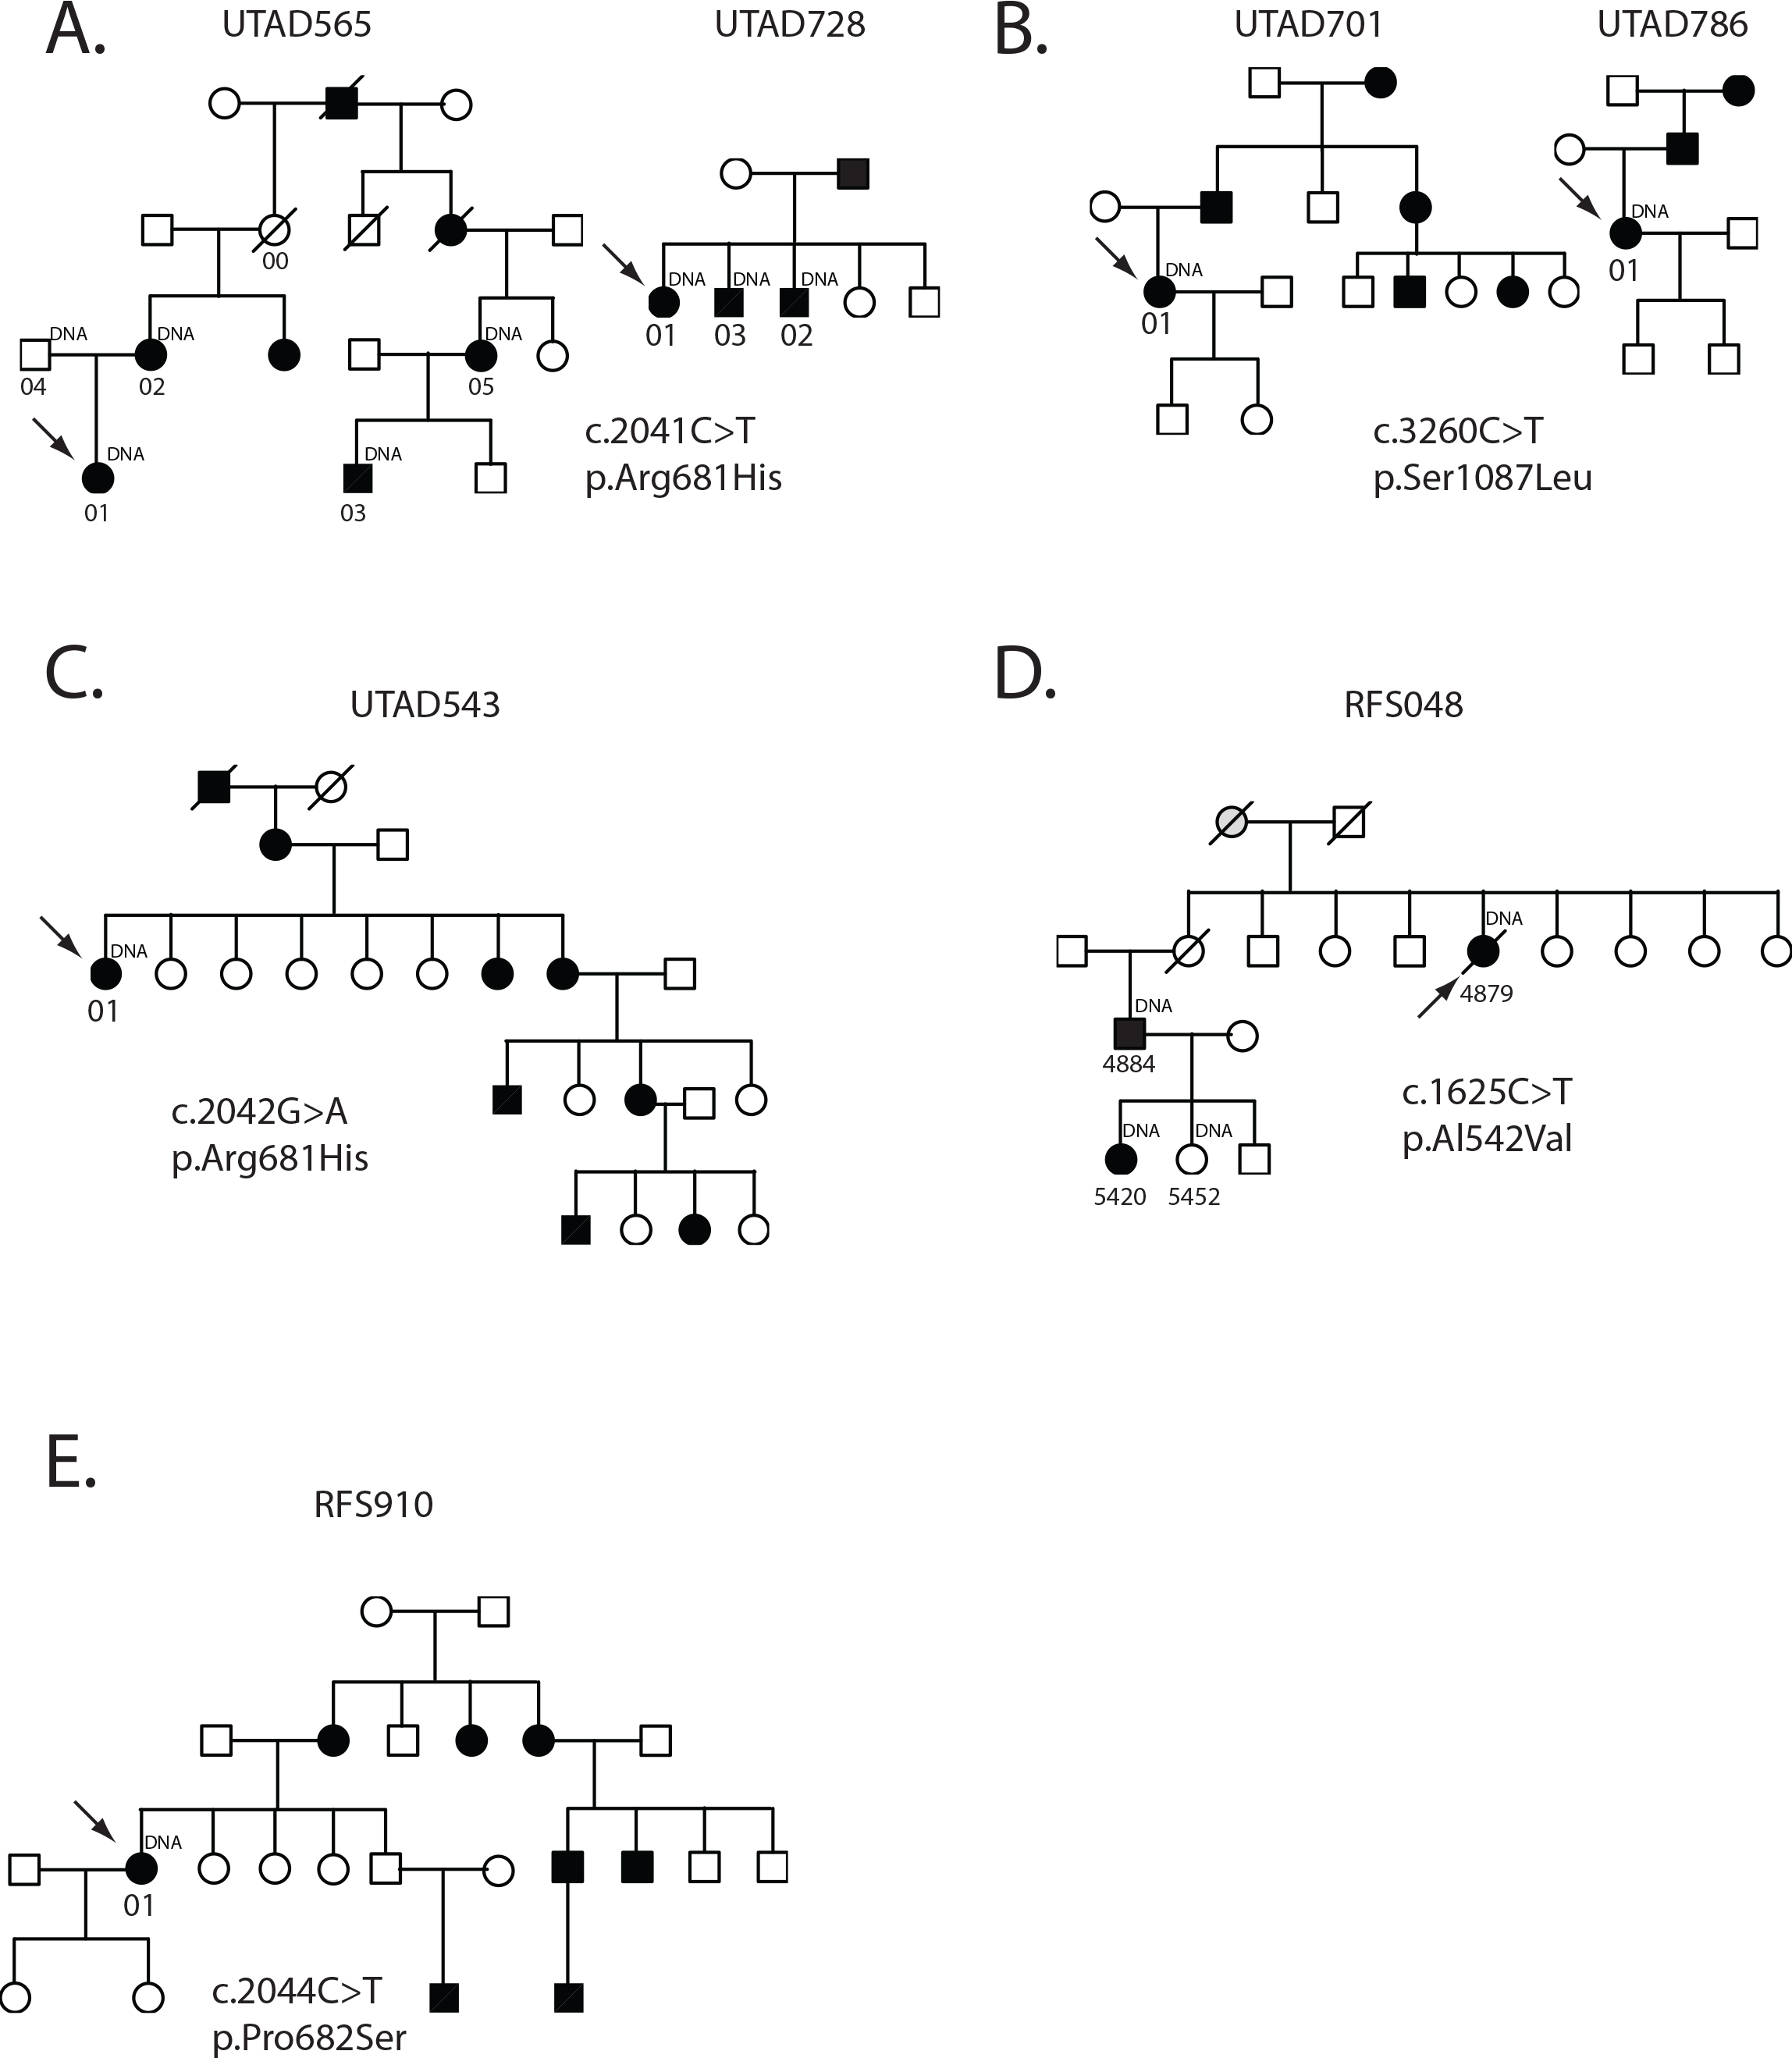
Figure 1. Families with
SNRNP200 mutations.
A: Two families with a c.2041C>T, p.Arg681His mutation.
B: Two families with a c.3260C>T, p.Ser1087Leu mutation
C: Family with a c.2042G>A, p.Arg681His mutation
D: Family with c.1625C>T, p.Ala542Val mutation
E: Family with a c.2044C>T, p.Pro682Ser mutation. Circles indicate women; squares indicate men. Black filled symbols are affected
individuals, grey filled symbols are possibly affected individuals, and open symbols are unaffected individuals. Arrows indicated
each family’s proband. Individual ID numbers corresponding to
Table 2 are underneath each symbol.
 Figure 1 of
Bowne, Mol Vis 2013; 19:2407-2417.
Figure 1 of
Bowne, Mol Vis 2013; 19:2407-2417.