Figure 4 of
Whitmore, Mol Vis 2013; 19:2274-2297.
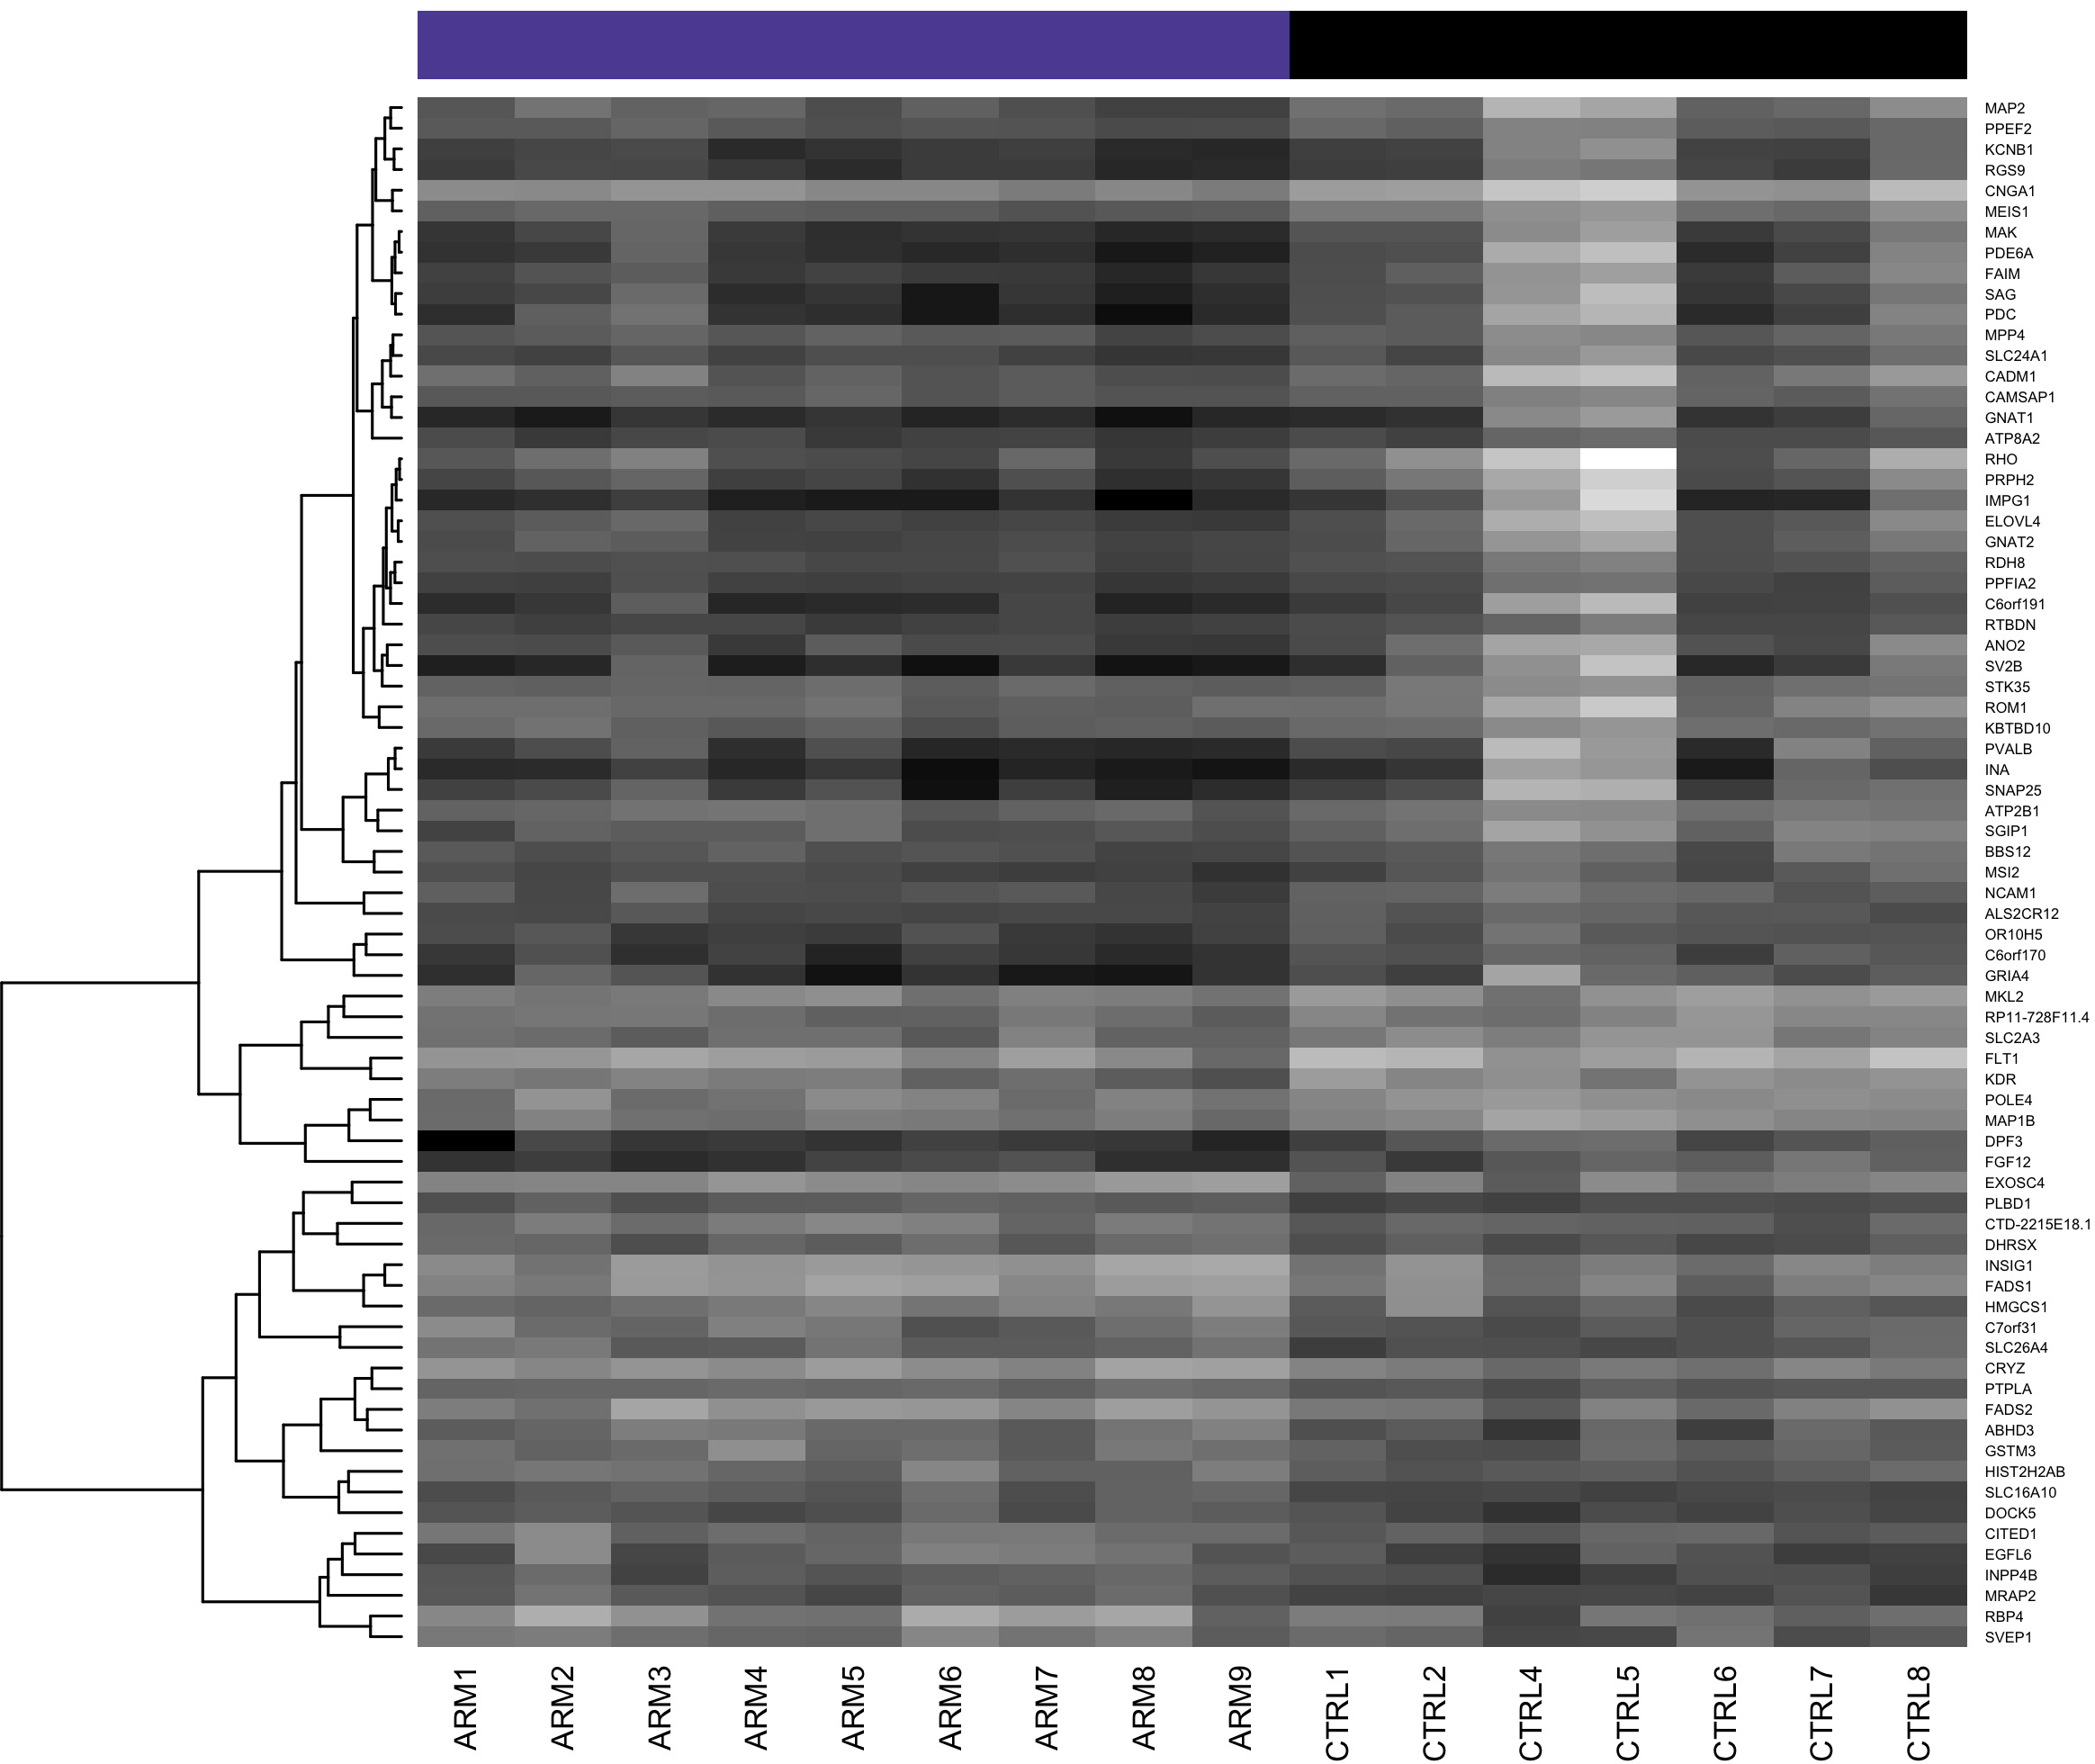
Figure 4.
Heatmap of differentially expressed genes shown in
Table 2
. Dark shading indicates low expression; light shading indicates high expression.
 Figure 4 of
Whitmore, Mol Vis 2013; 19:2274-2297. Figure 4 of
Whitmore, Mol Vis 2013; 19:2274-2297.
Figure 4 of
Whitmore, Mol Vis 2013; 19:2274-2297. Figure 4 of
Whitmore, Mol Vis 2013; 19:2274-2297.