Figure 3. Concentration-dependent effect of bradykinin (BK) on mobilization of [Ca
2+]
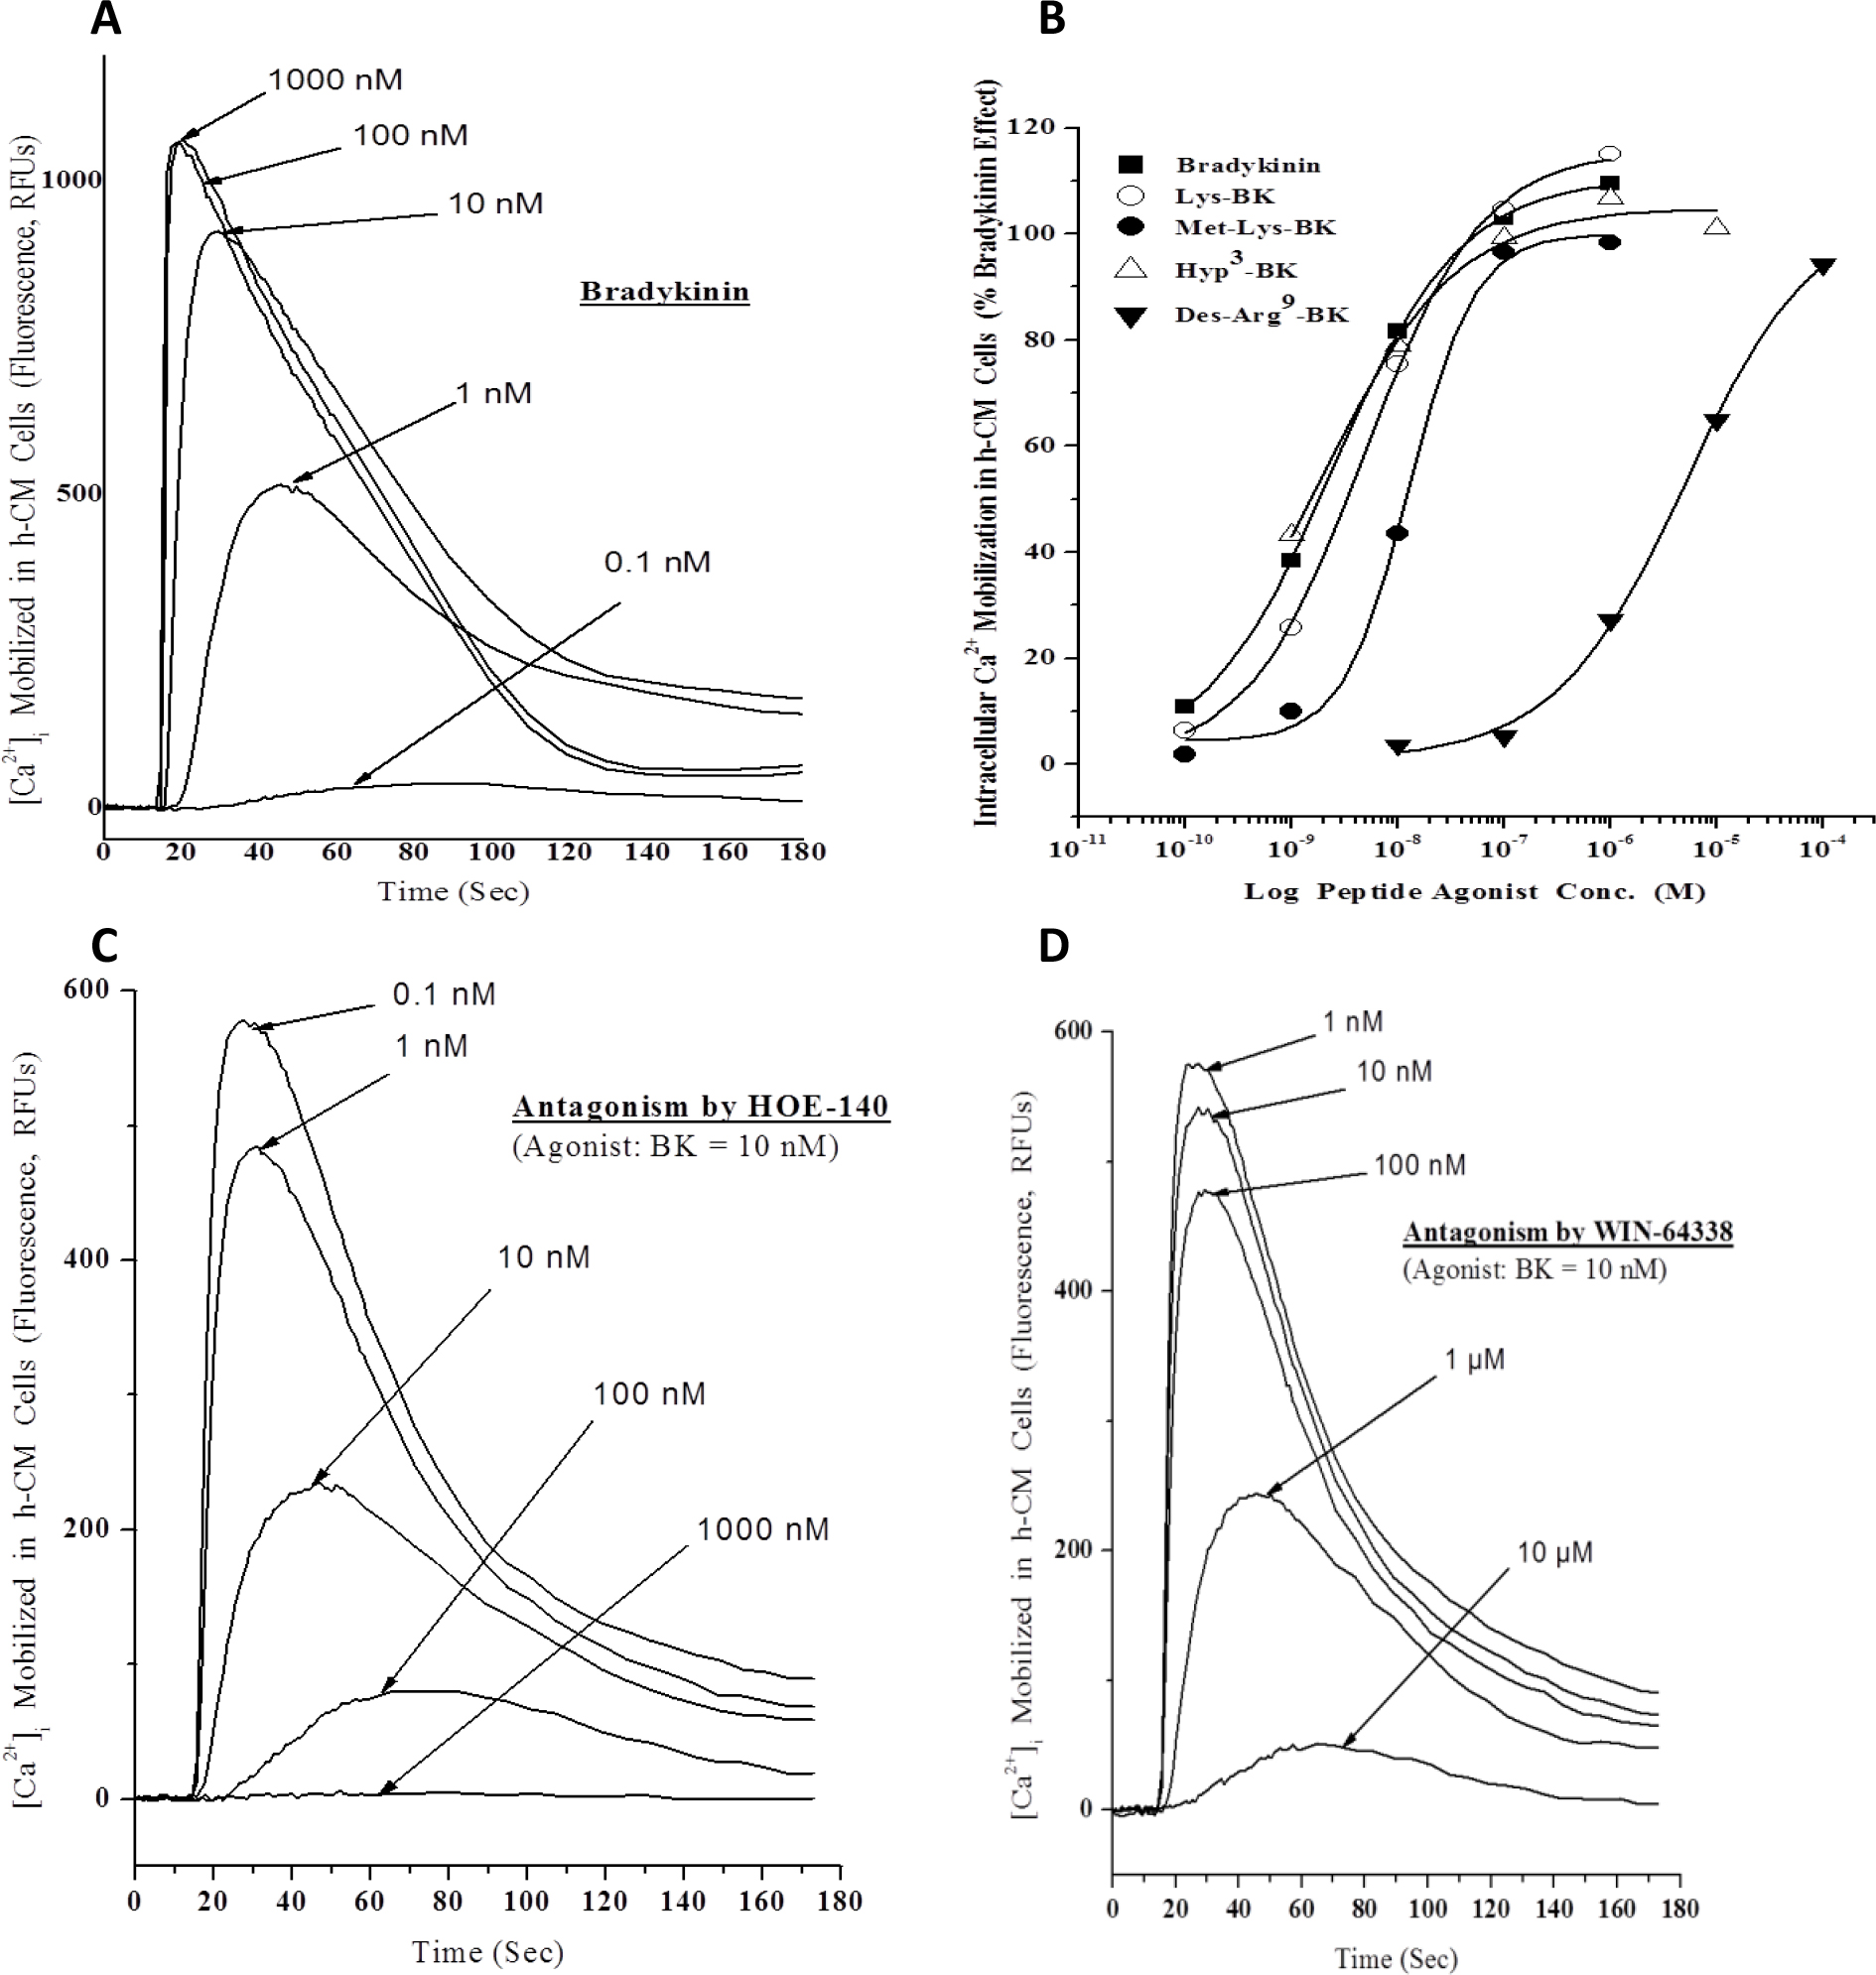
i in normal, primary h-CM cells. Fluorescent dye-loaded h-CM cells were exposed to different concentrations of BK and the changes
in relative fluorescence units (RFUs), indicating changes in levels of [Ca
2+]
i, monitored over time (
Figure 3A). The peak responses to various BK concentrations were then used to construct the concentration-response curves. Other BK-related
peptides were tested in the same manner and their concentration-response curves plotted (e.g., data from a representative
experiment;
Figure 3B). Agonist potency data from many such experiments were obtained and are shown in
Table 1 as mean ± SEM of EC
50 values (n=3–7). The effects of a peptide B
2-receptor antagonist (HOE-140;
Figure 3C) and a non-peptide antagonist (WIN-64338;
Figure 3D) on BK (10 nM)-induced elevation of [Ca
2+]
i were also determined, and antagonist potencies derived (
Table 1, lower section).
 Figure 3 of
Sharif, Mol Vis 2013; 19:1356-1370.
Figure 3 of
Sharif, Mol Vis 2013; 19:1356-1370.