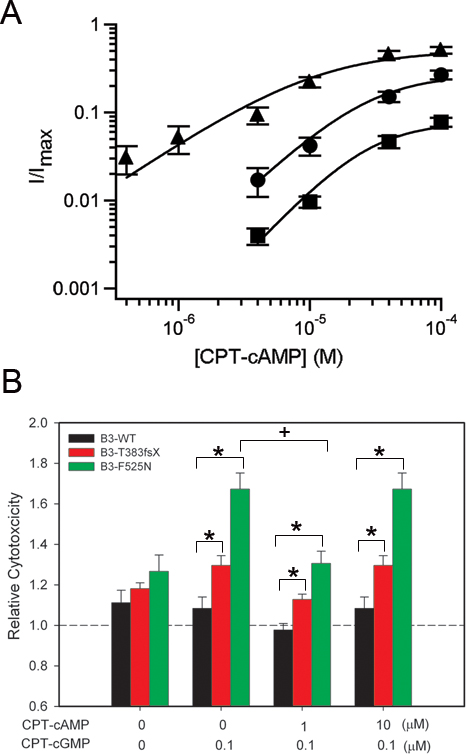
Figure 5. Effect of combined exposure to CPT-cAMP and CPT-cGMP on cytotoxicity of cells expressing channels with disease-associated
mutations in CNGB3.
A: Representative dose–response relationships for CPT-cAMP activation of CNG channels, after coexpression of CNGA3 with CNGB3-WT
(circles), T383fsX (squares), or F525N (triangles) subunits (same representative patches as in
Figure 1B). Currents were normalized to the maximum CPT-cGMP current. Continuous curves represent fits of the dose–response relationship
with the Hill equation. Parameters for each channel type were as follows: for WT,
K1/2,CPT-cAMP=28.3 μM and
h=1.4; for T383fsX,
K1/2, cAMP=27.9 μM and
h=1.6; and for F525N,
K1/2,CPT-cAMP=10.8 μM and
h=1.0.
B: Bar graph of the relative cytotoxicity for channel-expressing cells exposed to various concentrations of CPT-cAMP plus 0.1
μM CPT-cGMP (n=12). The dashed line represents the percentage of cell death in the vector-only control group without treatment;
* indicates significant difference between groups designated by bracket (p<0.05); + represents significant difference between
the F525N group treated with 10 μM CPT-cAMP together with 0.1 μM CPT-cGMP and the F525N group without treatment (p<0.01).
 Figure 5 of
Liu, Mol Vis 2013; 19:1268-1281.
Figure 5 of
Liu, Mol Vis 2013; 19:1268-1281.