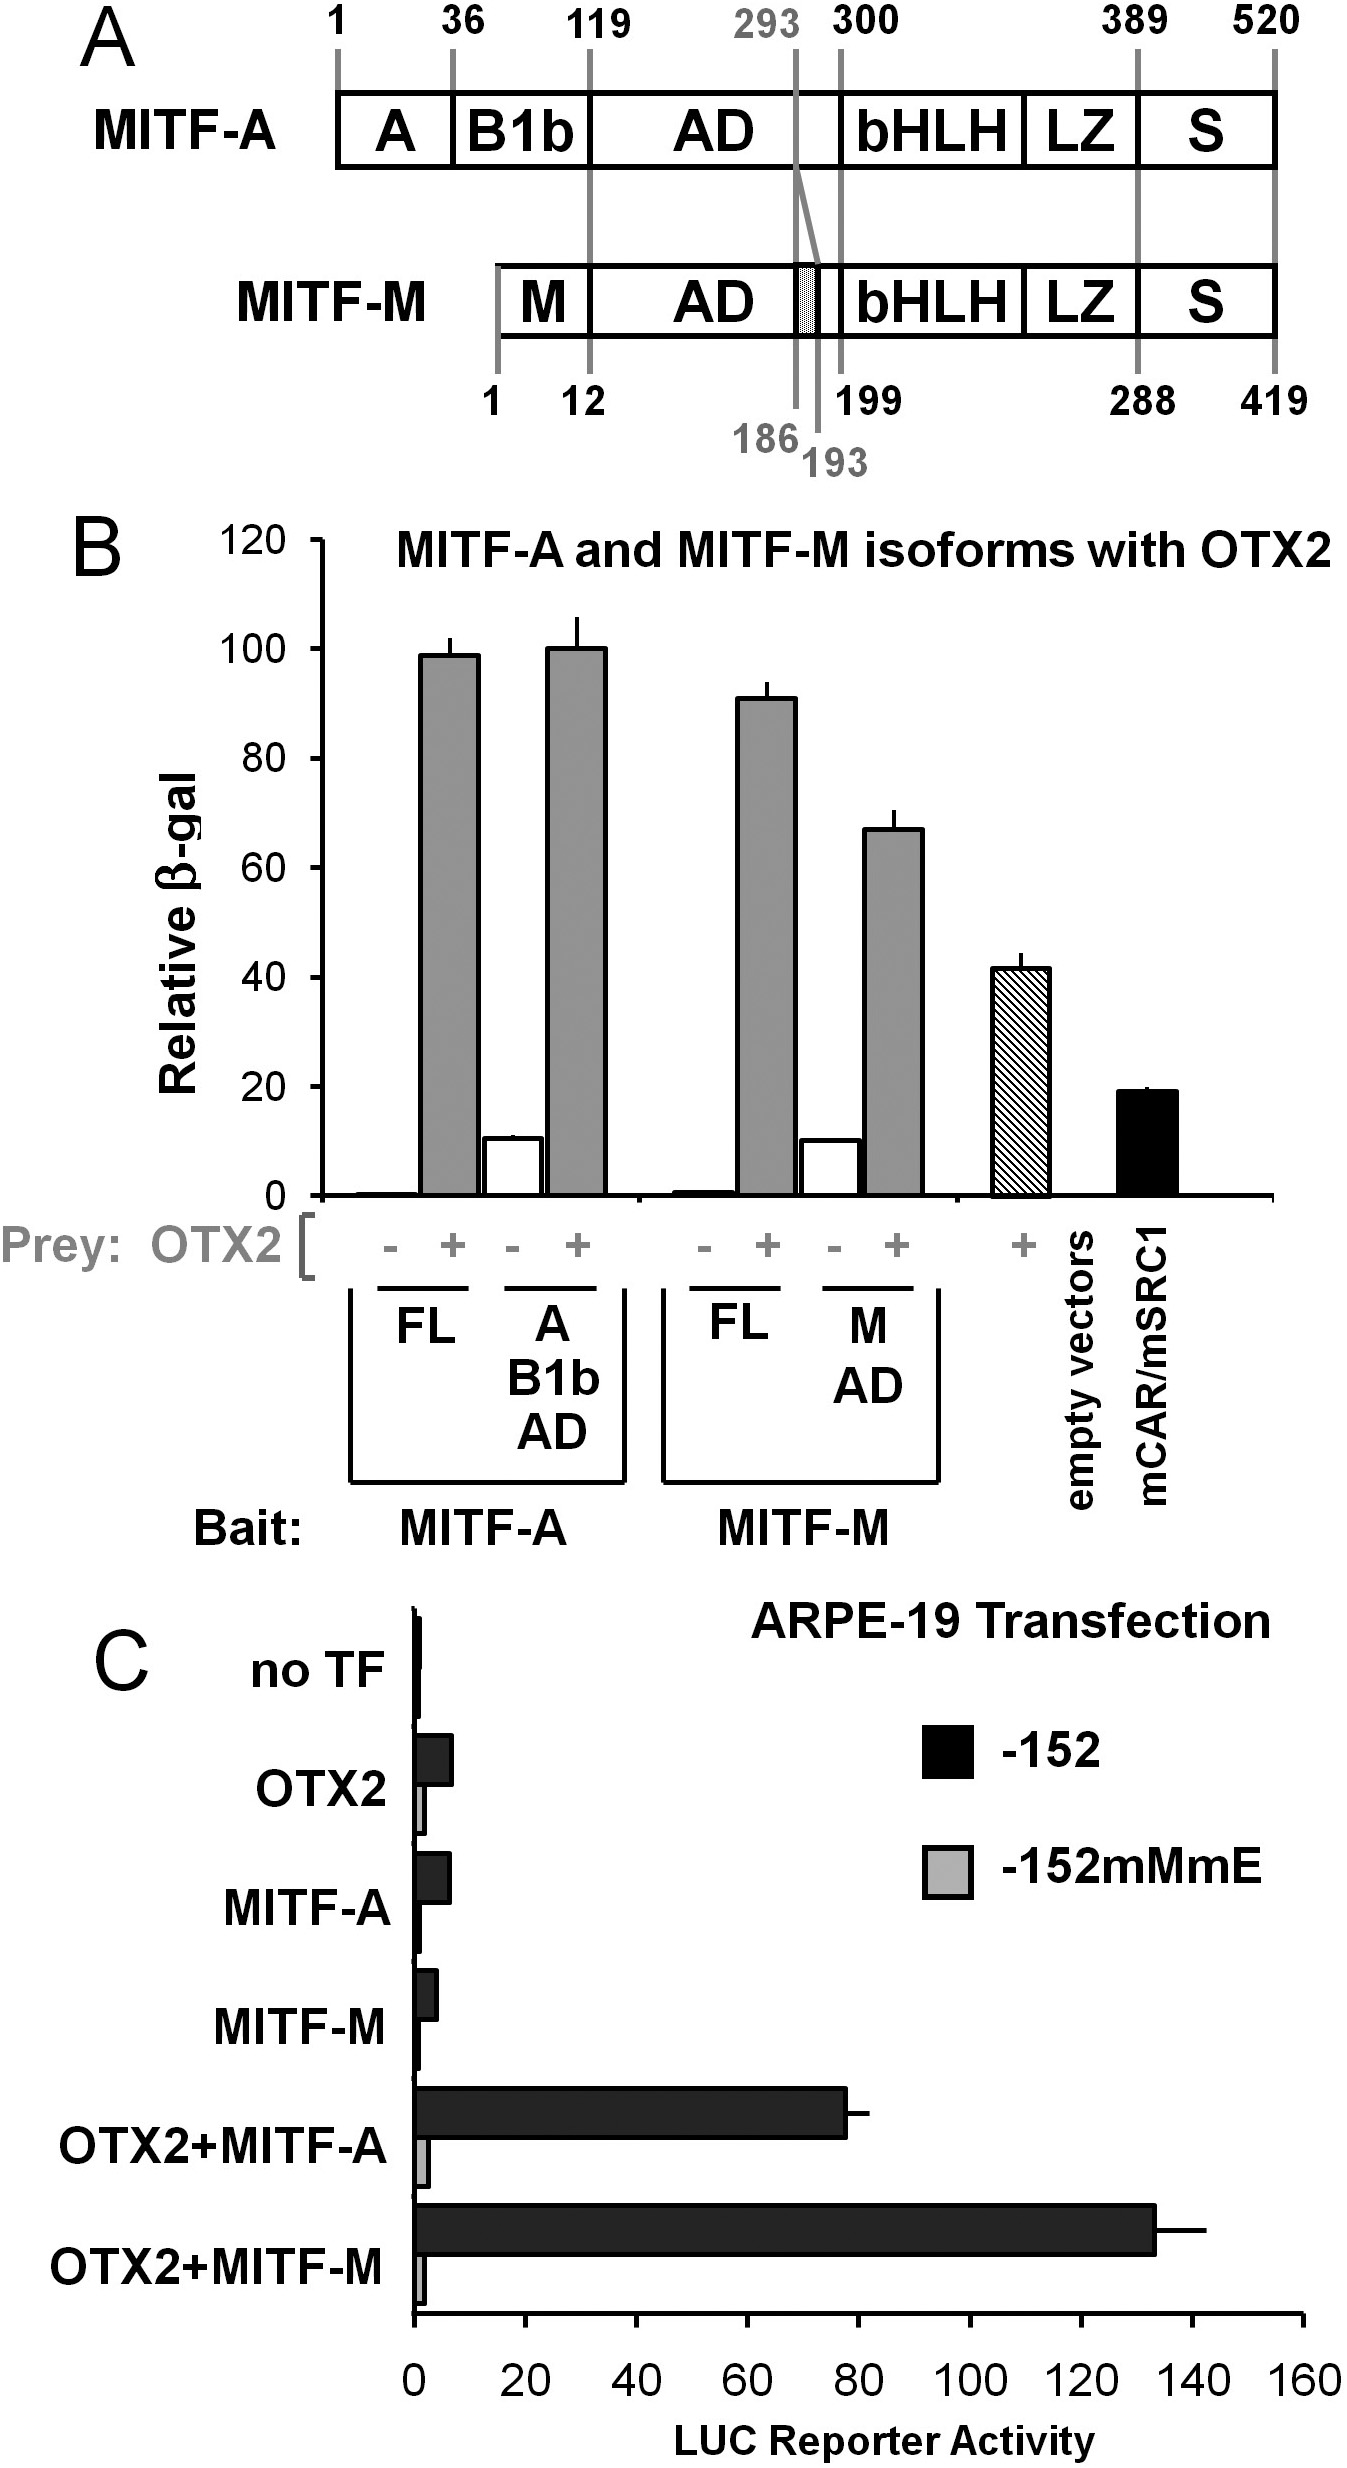
Figure 8. Effects of the MITF
isoforms A and M are comparable.
A: Full-length (FL)
MITF isoforms A and M and their known domains are shown with the
corresponding amino acids: MITF-A domains
A,
B1b,
and
AD, common domains
bHLH-LZ and
S,
and the MITF-M specific N-terminal region (
M). Additional
six amino acids of the M isoform (aa187–192) are shown.
B:
Interactions of the full-length OTX2 and domains from the MITF
isoform A (FL: aa1–520; A-B1b-AD: aa1–297) or M (FL: aa1–419;
M-AD: aa1–196) were measured and are shown with gray columns.
The level of MITF auto-activation is indicated by white columns.
Assays were performed as in
Figure 7 from three
independent experiments each performed in quadruplicate.
C:
ARPE-19 cells were cotransfected with the proximal
TYR
promoter lacking any OTX2 sites but with intact (−152: black
columns) or mutated MITF binding sites (−152mMmE: gray columns).
Normalized luciferase activities are relative to
TYR
promoter construct −152 (=1) cotransfected with the empty
expression vector pCR3 (=no TF). Data are means±SEM from two
independent transfections each performed in triplicate.
 Figure 8
of Reinisalo, Mol Vis 2012; 18:38-54.
Figure 8
of Reinisalo, Mol Vis 2012; 18:38-54.