Figure 7. Protein–protein
interactions occur between OTX2 and MITF-A. A:
Full-length (FL) MITF-A and OTX2 and their known domains are
shown with the corresponding amino acids as follows: MITF-A
specific N-terminal (A), N-terminal region common in
MITF-A and several other isoforms (B1b), activation domain (AD),
basic helix–loop–helix leucine zipper (bHLH-LZ), and serine-rich
C-terminal activation domain (S); OTX2 DNA-binding homeodomain
(HD); and N- and C-terminal activation domains (ND, CD). B:
Interactions of full-length OTX2 with various MITF-A domains
(FL: aa1–520; A-B1b-AD: aa1–297; A-B1b: aa1–124; B1b-AD:
aa36–297; AD: aa118–297; bHLH-LZ: aa295–405 or S: aa402–520) are
shown by gray columns. Auto-activation of each “bait” MITF-A
domain alone is indicated by white columns and for the
full-length OTX2 “prey” construct by the hatched column. C:
Interactions of selected MITF-A domains (FL, A-B1b-AD, AD, or S)
with various OTX2 domains (FL: aa1−297; ND: aa1−37; HD: aa37−109
or CD: aa107−297) were assessed (gray columns) and compared with
empty “bait” vectors (white columns). Assays were controlled
with the yeast strain carrying empty “bait” and “prey” vectors
or the positive control mCAR/SRC1 (black columns). Results are
means±SEM relative to the maximal activation of the
β-galactosidase reporter (=100) from three independent assays
each performed in quadruplicate..
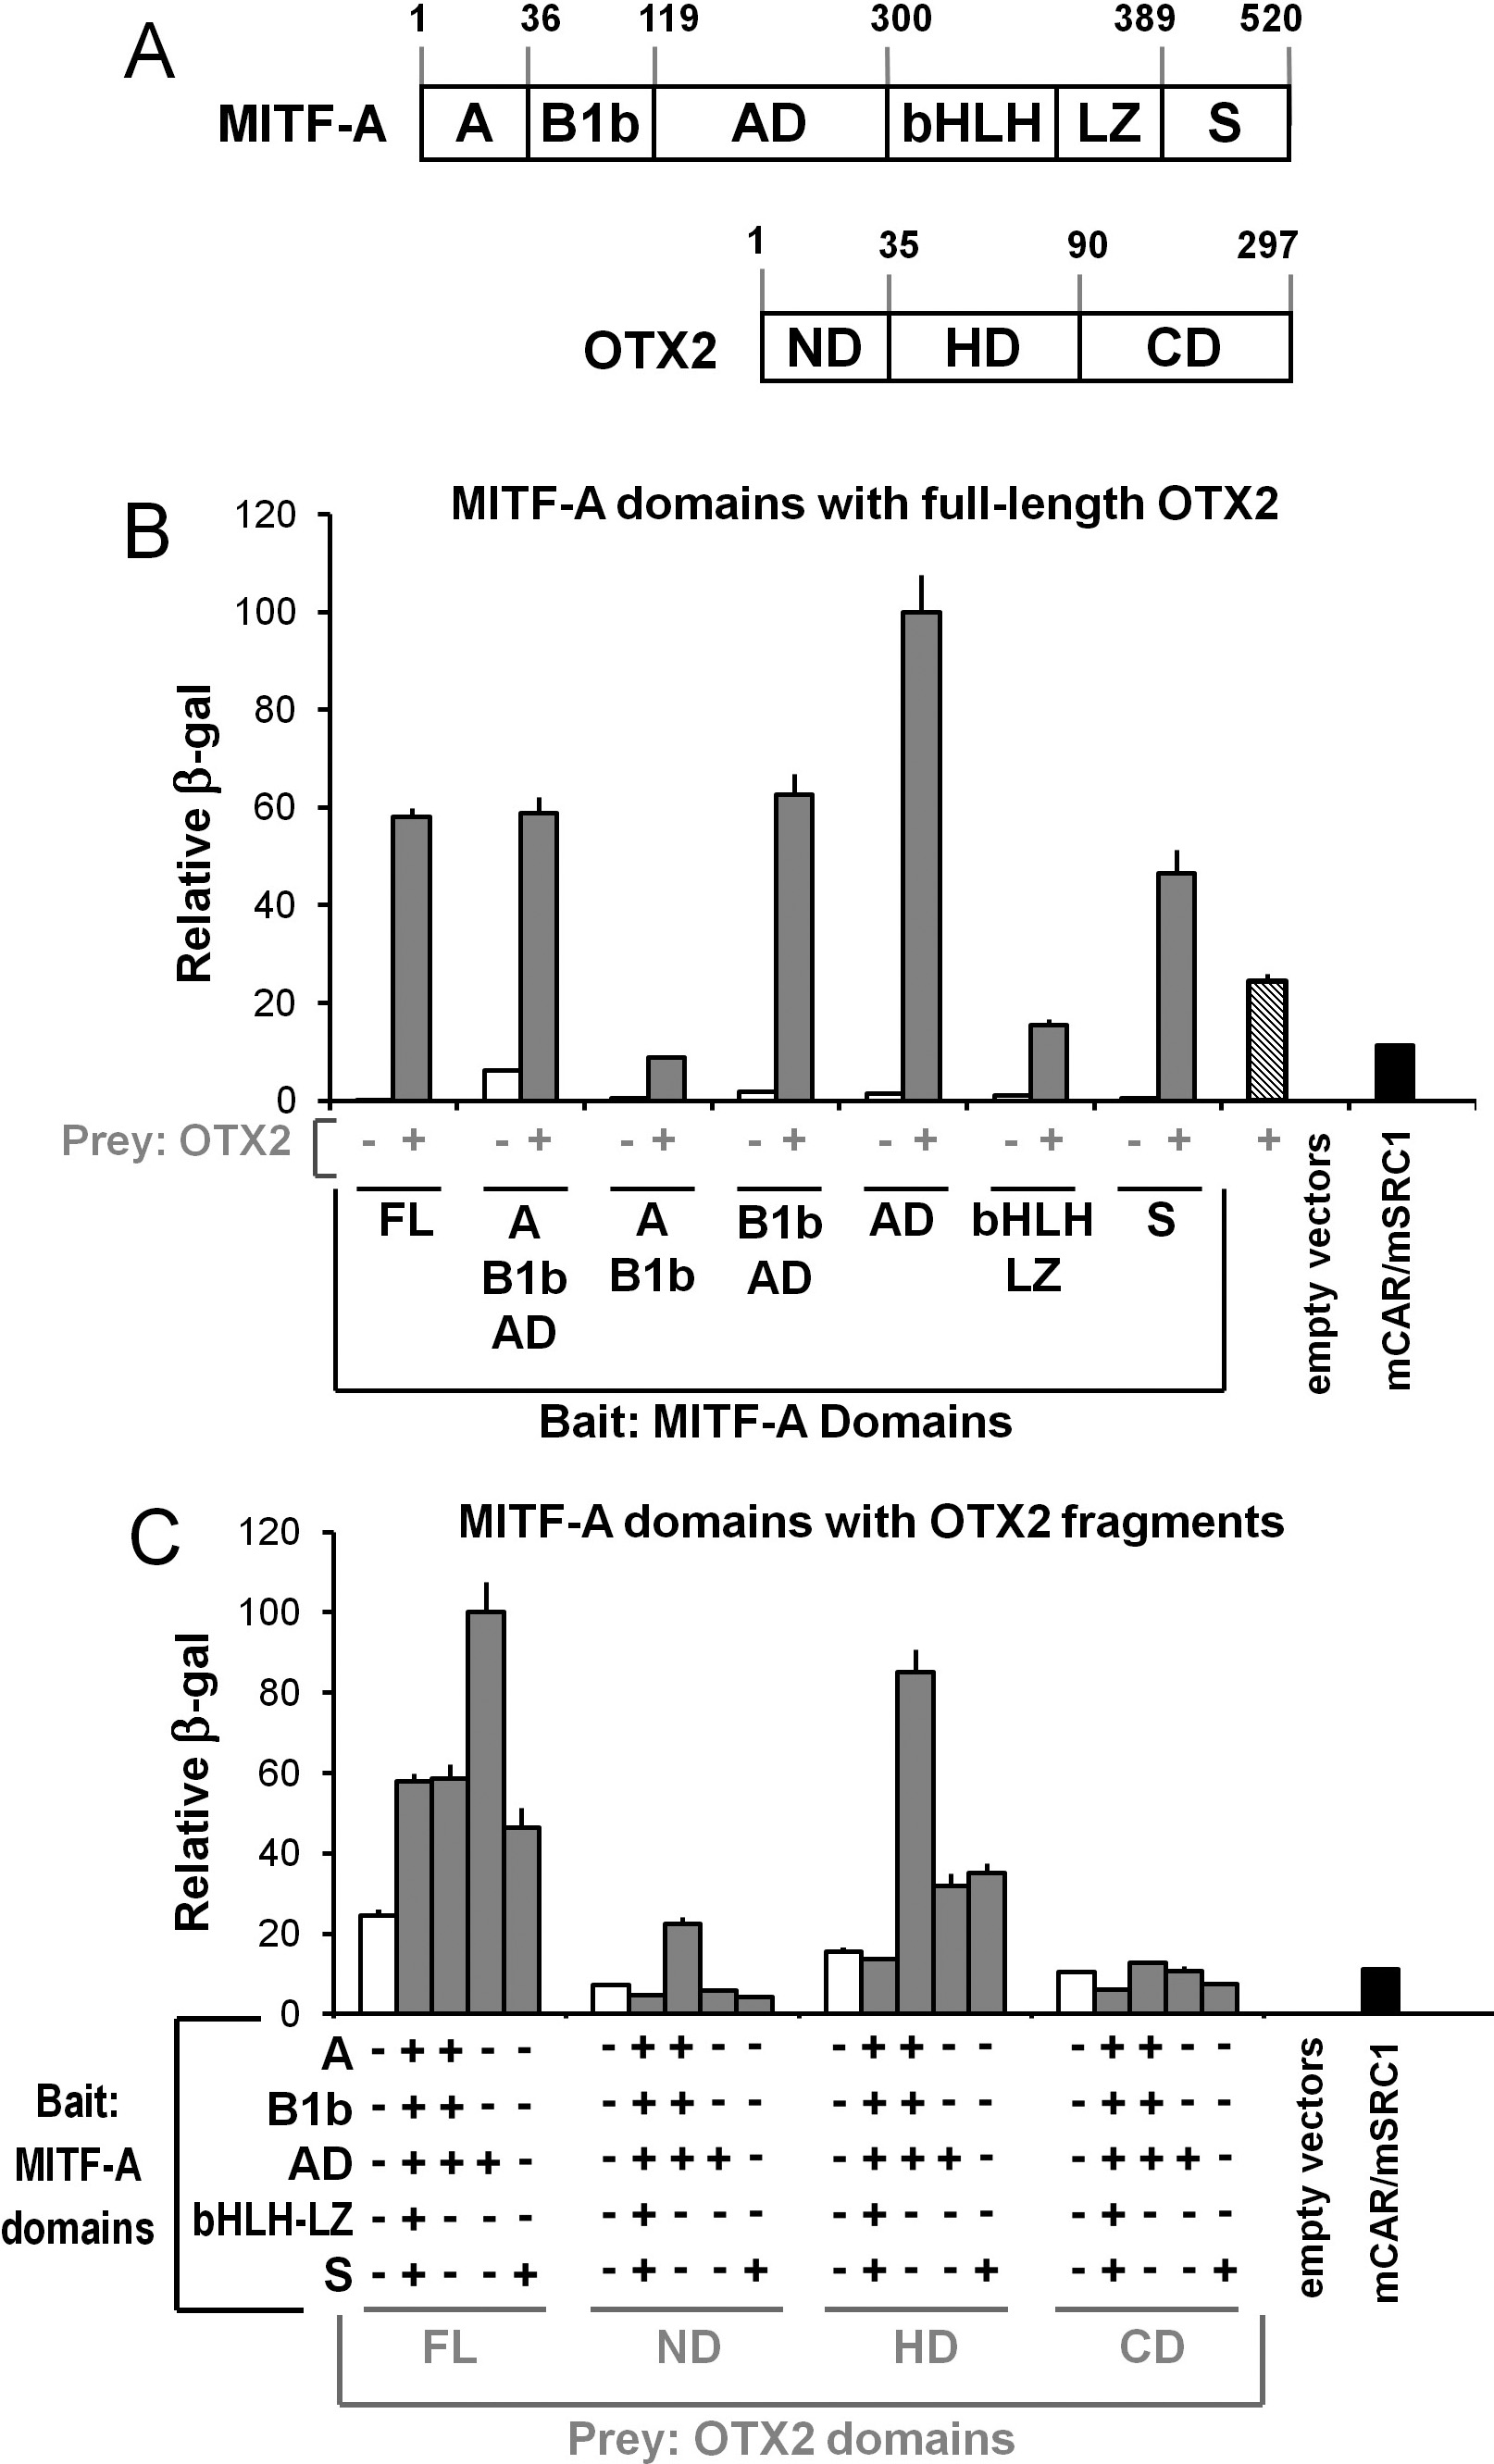
 Figure 7
of Reinisalo, Mol Vis 2012; 18:38-54.
Figure 7
of Reinisalo, Mol Vis 2012; 18:38-54.