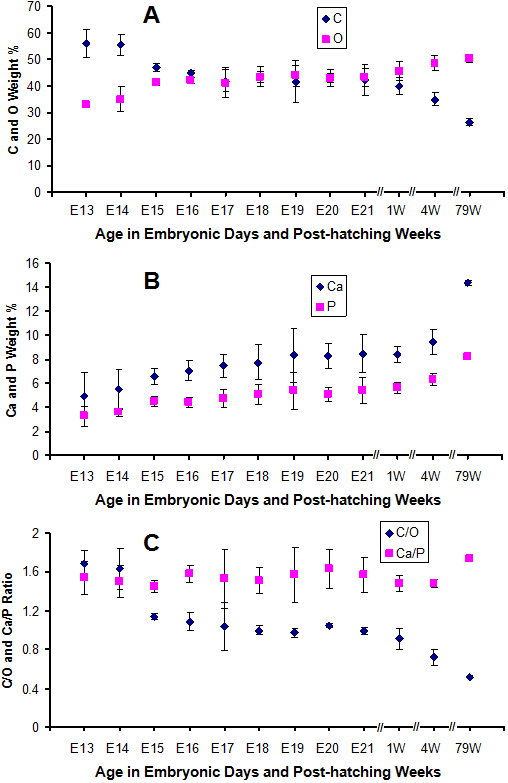
Figure 9. Quantification of the mineralization of chicken ossicles. Data were derived from the interior region of each ossicle, as viewed
in cross-section (
Figure 7)
A: Patterns of C and O in chicken ossicles during development;
B: Patterns of Ca and P in chicken ossicles during development;
C: C/O and Ca/P ratios in chicken ossicles during development. Crosshatch gaps (//) are shown between the E21 and 1 week ages,
and between the older ages to emphasize that the time scales in these 3 regions are not a linear continuous line.
 Figure 9 of
Zhang, Mol Vis 2012; 18:348-361.
Figure 9 of
Zhang, Mol Vis 2012; 18:348-361.