Figure 7. Representative FESEM EDS
mapping analysis of chicken ossicles. Surface (A, G)
and cross sectional (D, J) secondary electron
images and corresponding calcium (B, E, H,
and K) and phosphorus (C, F, I,
and L) EDS maps are presented from two different
developmental time periods: E14 (A, B, C,
D, E, and F) and E18 (G, H,
I, J, K, and L). In maps, white
pixels indicate both the intensity (quantity) and location of
the given element.
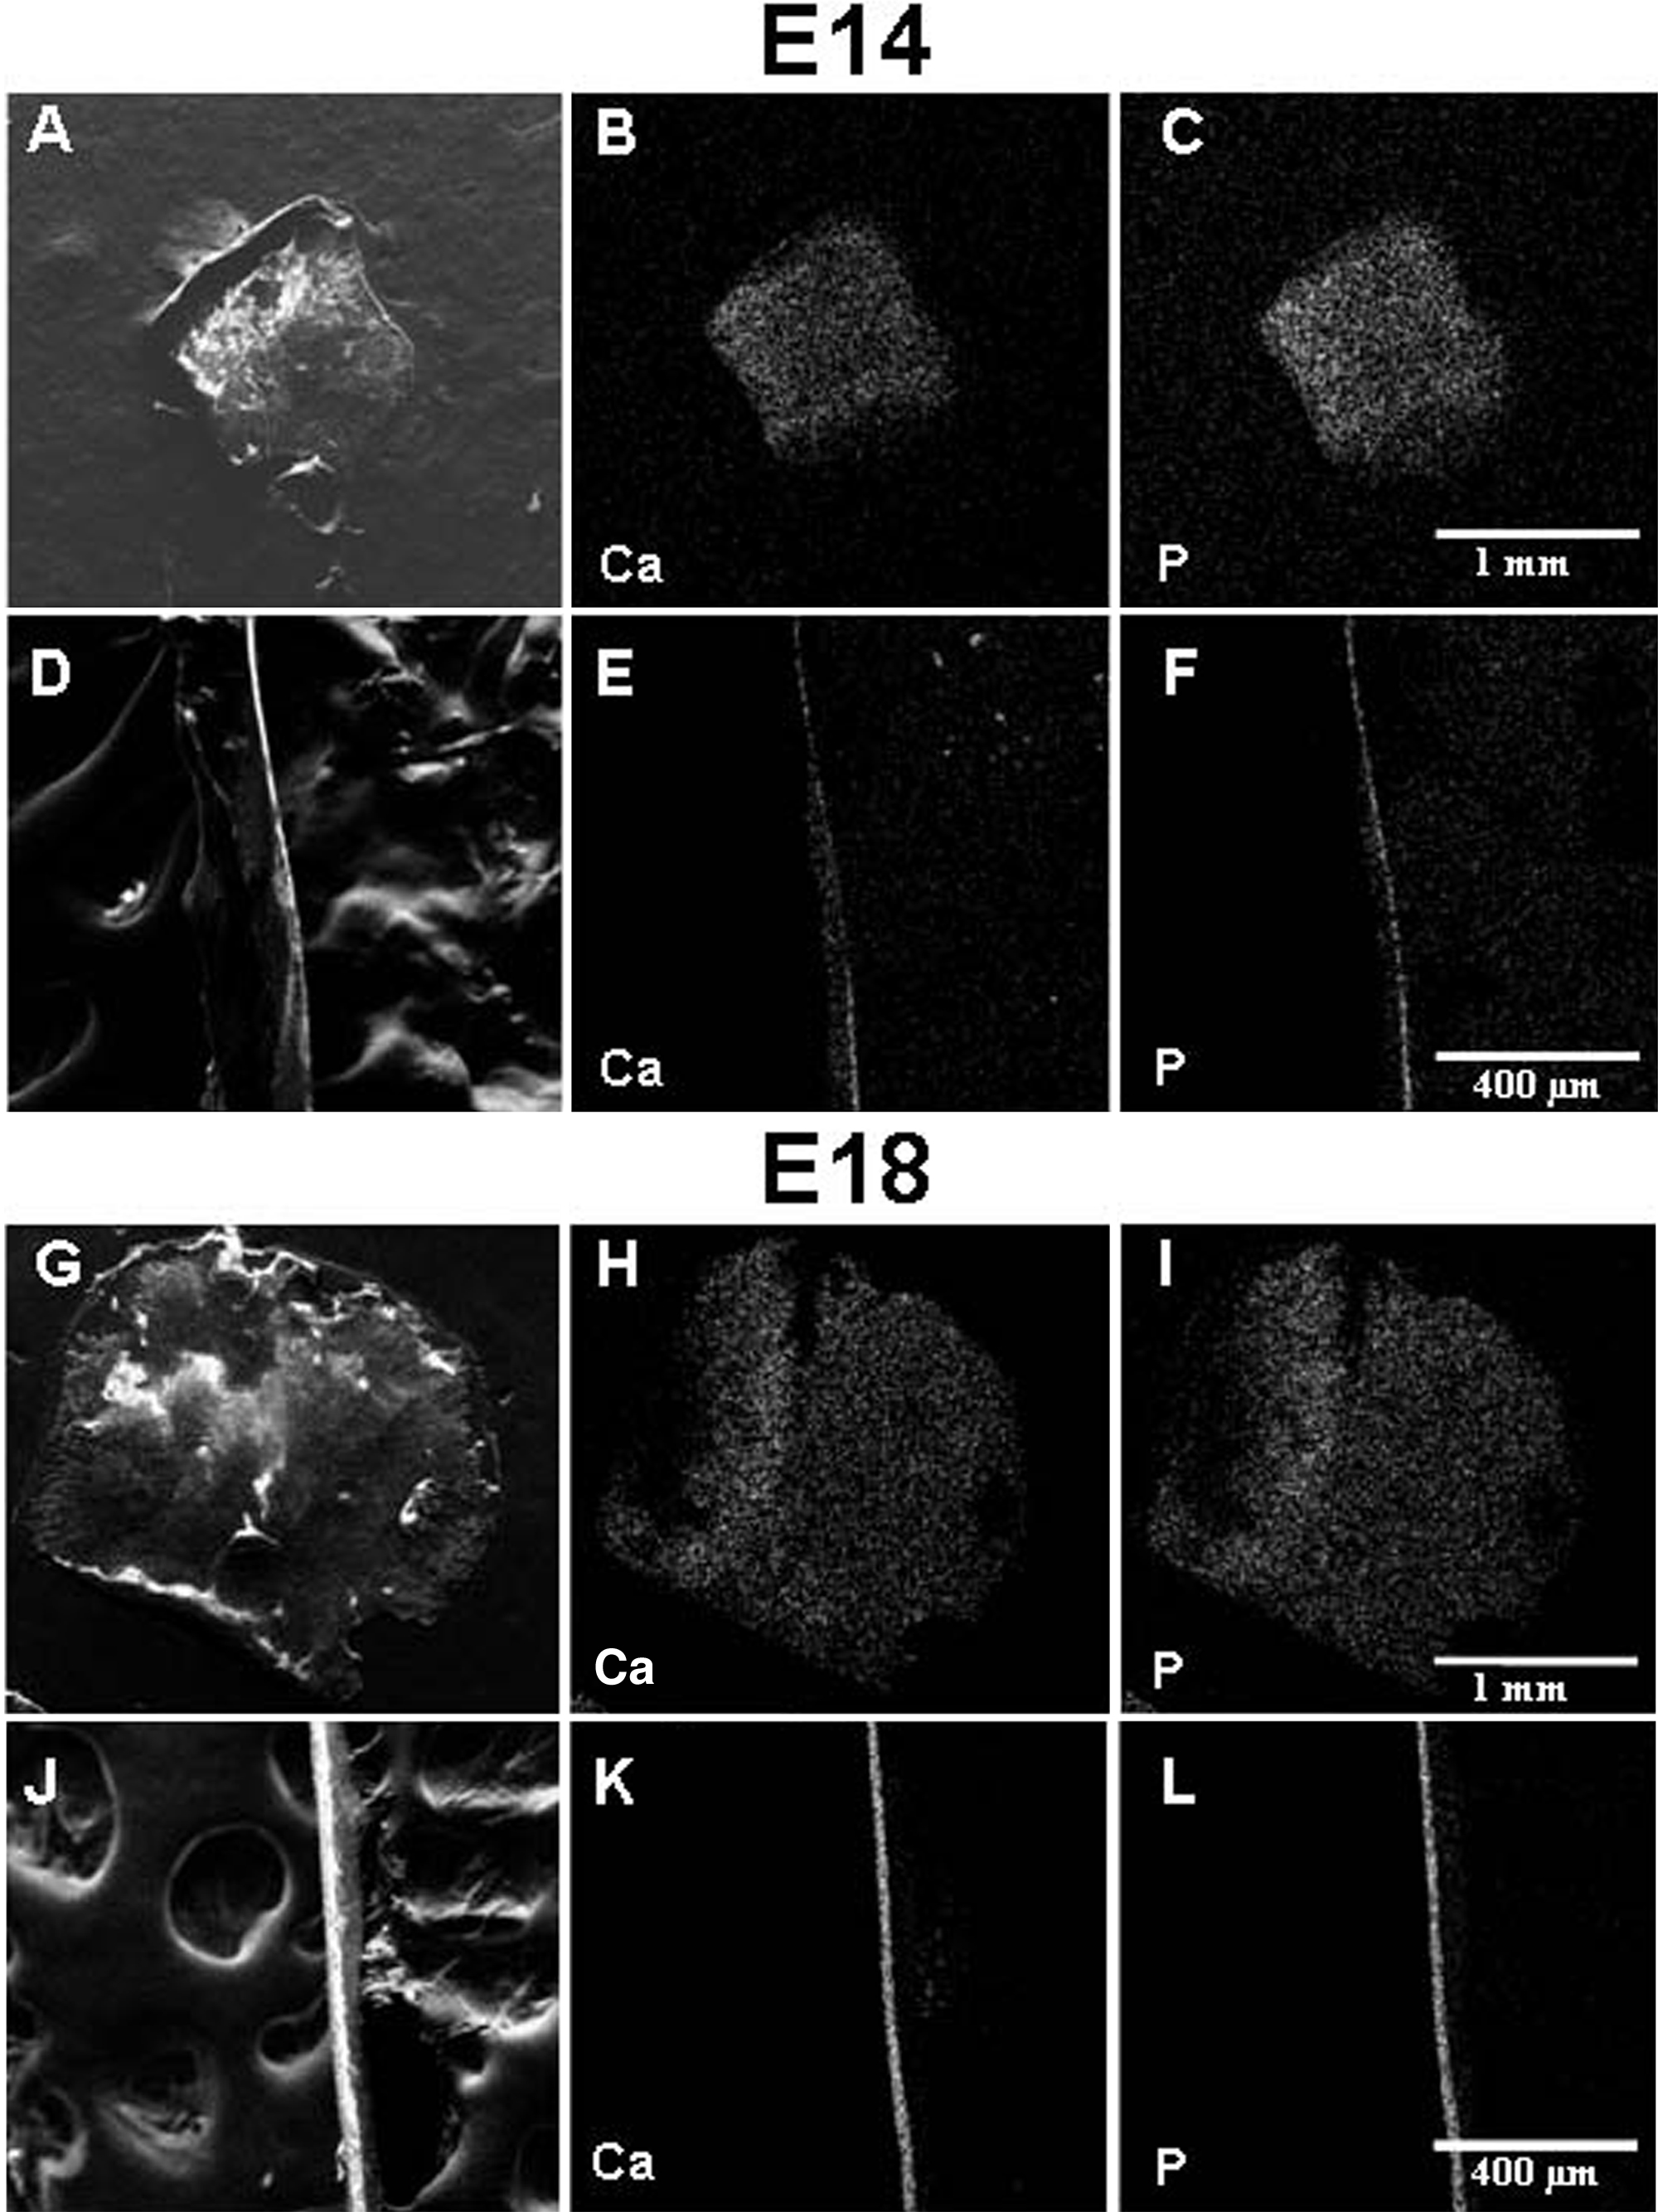
 Figure 7
of Zhang, Mol Vis 2012; 18:348-361.
Figure 7
of Zhang, Mol Vis 2012; 18:348-361.