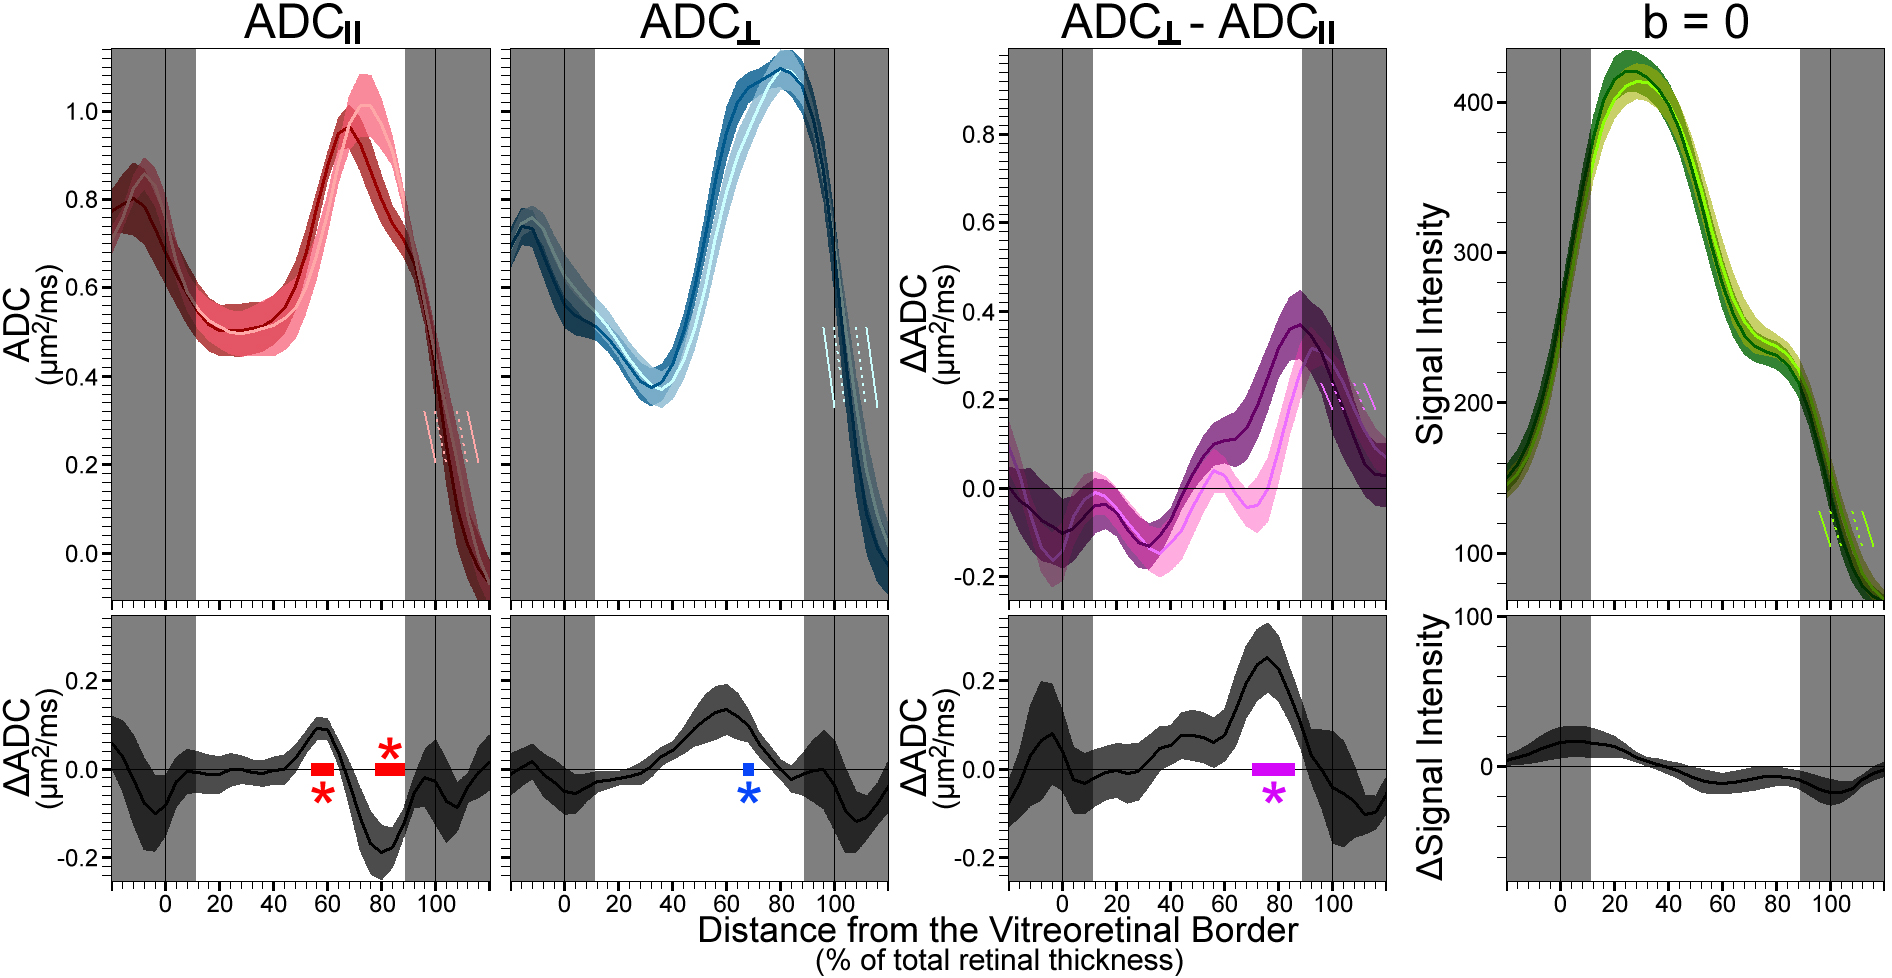
Figure 2. Summary of light-dependent changes in apparent diffusion coefficient (ADC).
Top: The mean(±standard error of the mean [SEM]) ADCs measured parallel to the optic nerve (ADC║) and measured perpendicular
to the optic nerve (ADC┴) are shown alongside the difference between those measures (ADC┴-ADC║; to examine diffusion anisotropy)
and the signal intensities of b=0 s/mm
2 images. All ADC data shown here is calculated using all five b values (0–990 s/mm2). Dark (color with darker shade) and light
data were compared at each point within 12%–88% thickness (in 4%thick increments). Shaded profile sections near the vitreoretinal
and retina-choroid borders (0%thick and 100%thick respectively, marked with vertical lines) were not evaluated because of
partial-volume averaging with nonretinal tissue. Light-colored line segments in these shaded areas show the position of the
mean light data if purposely misregistered (relative to dark) by ±4%thick (dotted line segment) or ±8%thick (solid line segment).
These misregistration steps were used post hoc to evaluate the robustness of dark-light ADC differences to registration errors.
Bottom: Dark-light difference plots (grayscale; mean±SEM) show where ADC
║, ADC
┴, and anisotropy (ADC
┴−ADC
║) changed within the retina (*q<0.05). Based on known anatomic borders (
Figure 3), we attribute ADC differences at 56%–68%thick to the anterior outer retina, which contains the rod nuclei, and differences
at 72%–88%thick to the posterior outer retina, which contains the rod outer segments. In each case of purposeful misregistration
by 4%thick, 8%thick, or 12%thick in either direction, dark-light comparisons of both ADC
║ and anisotropy (ADC
┴−ADC
║) yield multiple results with p<0.05 in the outer retina (not pictured). No significant differences in signal intensity were
found in b=0 data (bottom right plot; p>0.05 throughout). Note that the posterior one-third of the retina (68%–88%thick) tends
to have the lowest signal intensities at b=0, as well as the highest ADCs. For this reason, there is some risk that ADCs are
underestimated when the data with the lowest signal (b=990 s/mm
2) are used to calculate the ADC. As noted in the results section for assessing signal-to-noise relevant to ADC calculations,
the pictured ADCs for the anterior two-thirds of the retina (12%–64%thick) appear accurate, but the ADCs for the posterior
one-third of the retina (68%–88%thick) may ultimately be approximately 17% higher than pictured here. Importantly, the pictured
dark-light differences remain significant regardless of the analysis strategy.
 Figure 2 of
Bissig, Mol Vis 2012; 18:2561-2577.
Figure 2 of
Bissig, Mol Vis 2012; 18:2561-2577.