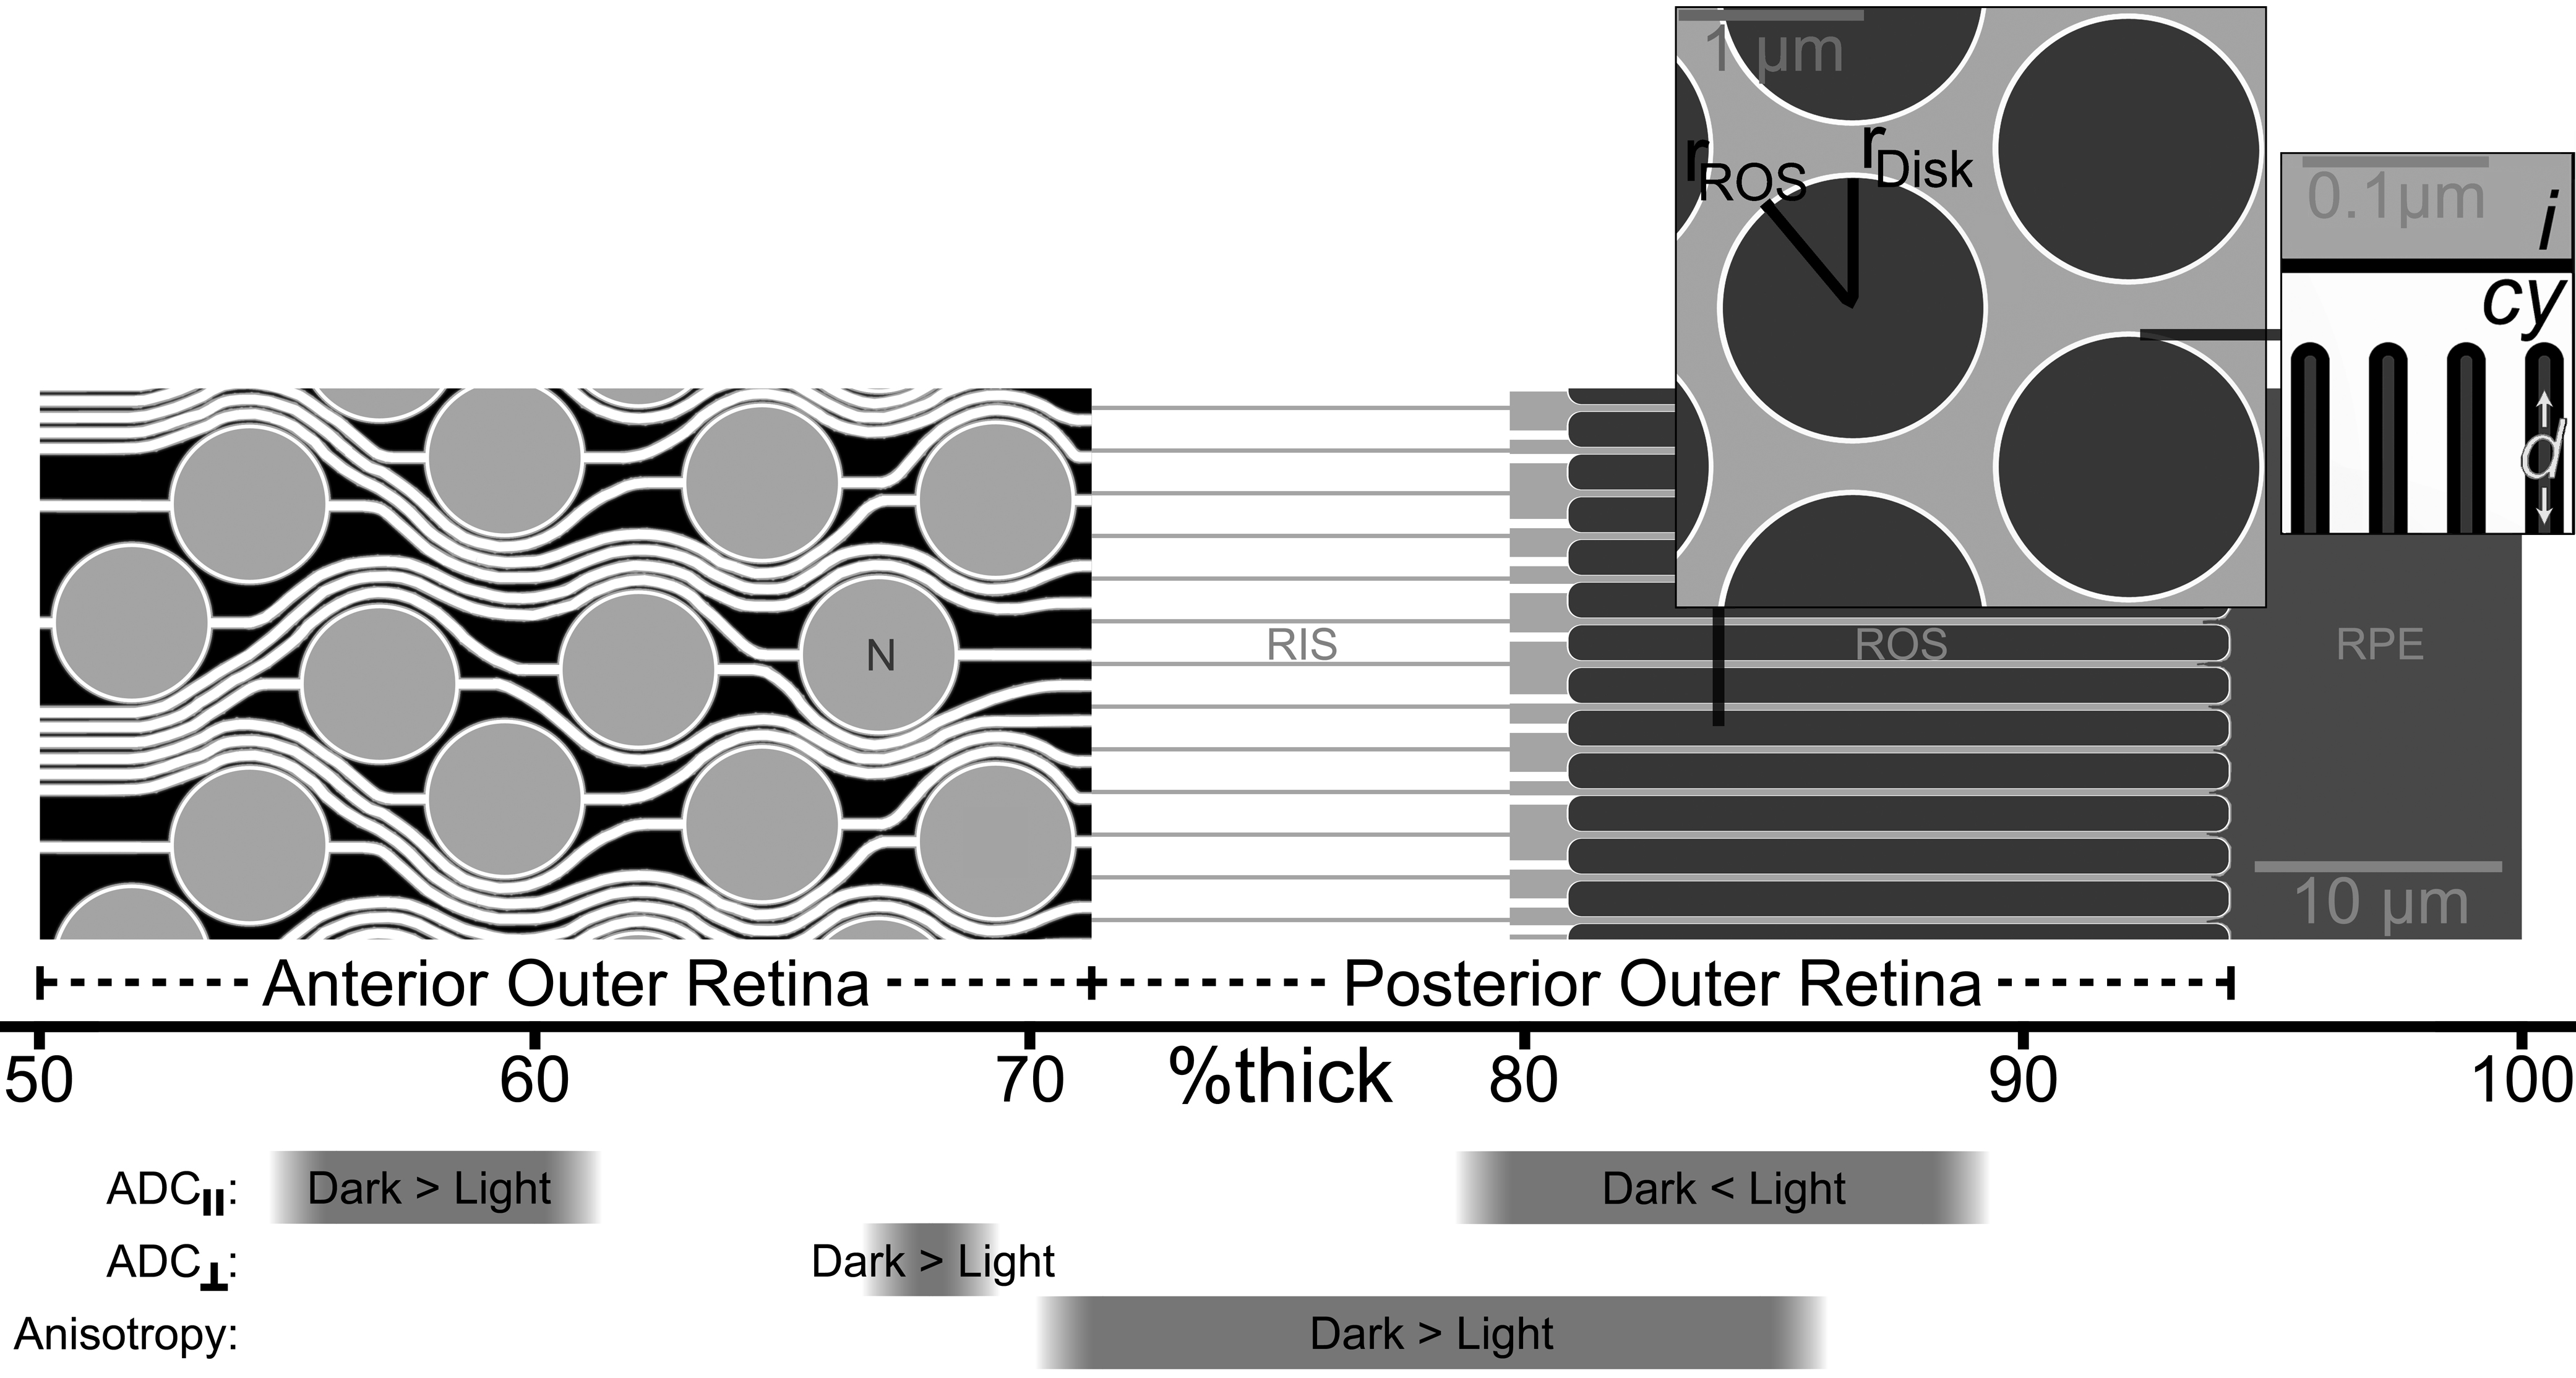
Figure 3. Locations of significant light-dependent changes in apparent diffusion coefficient (ADC) are shown relative to known outer
retinal morphology. Unique light-dependent changes were found for ADCs measured parallel to the optic nerve (ADC║), perpendicular
to the optic nerve (ADC┴), and in diffusion anisotropy (i.e., ADC┴ - ADC║). Central retinal rods and associated structures
are depicted to scale, based on the well documented layered microstructure of the rat retina, with rod nuclei (N) and rod
inner and outer segments (RIS, ROS) anterior to the retinal pigment epithelium (RPE). The rod cytoplasm is shown in white,
interstitial space (and rod nuclei) in light gray, and processes from Müller glia in black between rod somas. The dimensions
of all structures are illustrated accurately based on the extensive body of literature for the rat retina, including the diameters
of rod nuclei [
43,
53], the connections between rod nuclei and other structures (“rod fiber” in [
43]), and the connection between RIS and ROS [
43,
54]. Note that the dimensions of each cellular element are based on an average of at least two literature sources. For illustrative
purposes, the main panel (which shows the ║ direction oriented from left to right) displays all structures centered on same
two-dimensional plane. Though this is a fair depiction of RIS and ROS, which are spaced in a regular hexagonal lattice [
32,
55], the arrangement of rod somas is less orderly, and it is generally not possible to see several neighboring rod nuclei at
full diameter in a single histological section. The gray within ROSs is a depiction of the several hundred photopigment-laden
disks (approximately 30.5 per μm of ROS length [
54-
60]) at low magnification, which is clarified in the inserts. Results and landmarks are depicted against the %thick scale used
for the mfADC data. Optical coherence tomography images of the rat retina [
61-
65] demonstrate that the distance from vitreoretinal border to the choroid is approximately 200 μm, with the following divisions:
the border between the outer plexiform layer and outer nuclear layer (i.e., the anterior-most position of the photoreceptor
nuclei) occurs approximately 101 μm from the vitreoretinal border (i.e., 50%thick); the division between outer nuclear layer
and the bacillary layer (posterior outer retina, containing rod inner and outer segments) occurs at approximately 143 μm (72%thick);
and the posterior limit of the rod outer segments occurs at approximately 187 μm (94%thick) from the vitreoretinal border,
with the remaining space to the choroid (at 100%thick) occupied by RPE. Histological studies of the rat retina are in good
agreement with those figures, showing that rod outer segments are approximately 27 μm long, while rod inner segments are approximately
two-thirds that length [
32,
43,
53,
55,
60,
66], for a combined approximately 45 μm span for the posterior half of the outer retina. The outer nuclear layer (which we refer
to as the anterior outer retina) is approximately 39 μm thick [
58-
60,
66-
69], and the distance between the outer nuclear layer and vitreoretinal border is approximately 106 μm [
67-
69]. Including an approximately 8 μm RPE [
68], histological studies therefore describe the anterior outer retina spanning from 53% to 73%thick, and a posterior outer
retina from 73% to 96%thick.
Left insert (║
into/out of plane): Cross sections show the radii of ROS (r
ROS) and disks contained within (r
Disk), along with the thin rim of cytoplasm that runs the length of the ROS between the disk and ROS membranes. The depiction
of ROS and disk radii are based on published electron micrographs, where r
ROS is approximately 0.73 μm [
32,
43,
54,
55,
57,
58] and the difference between r
ROS and r
Disk is approximately 0.03 μm [
54-
56,
60]. The inter-ROS spacing shown here is based on known photoreceptor density: an approximately 10 µm
2 area is illustrated here, and the literature’s ranges for packing density range from 3.1 to 4.0 rods per 10 µm
2 [
43,
59,
70].
Right insert (║
left/right): Fine detail of the ROS shows the location of intra-disk (
d) cytoplasmic (
cy) and interphotoreceptor (
i) water between membranes (black lines). The total disk thickness is depicted as equal to the thickness of the between-disk
cytoplasmic space, based on available information available for the rat [
54-
56,
60], and the pattern found in several other species [
71]. The range of literature values may be due to the sensitivity of ROS disks to fixation method [
54,
72].
 Figure 3 of
Bissig, Mol Vis 2012; 18:2561-2577.
Figure 3 of
Bissig, Mol Vis 2012; 18:2561-2577.