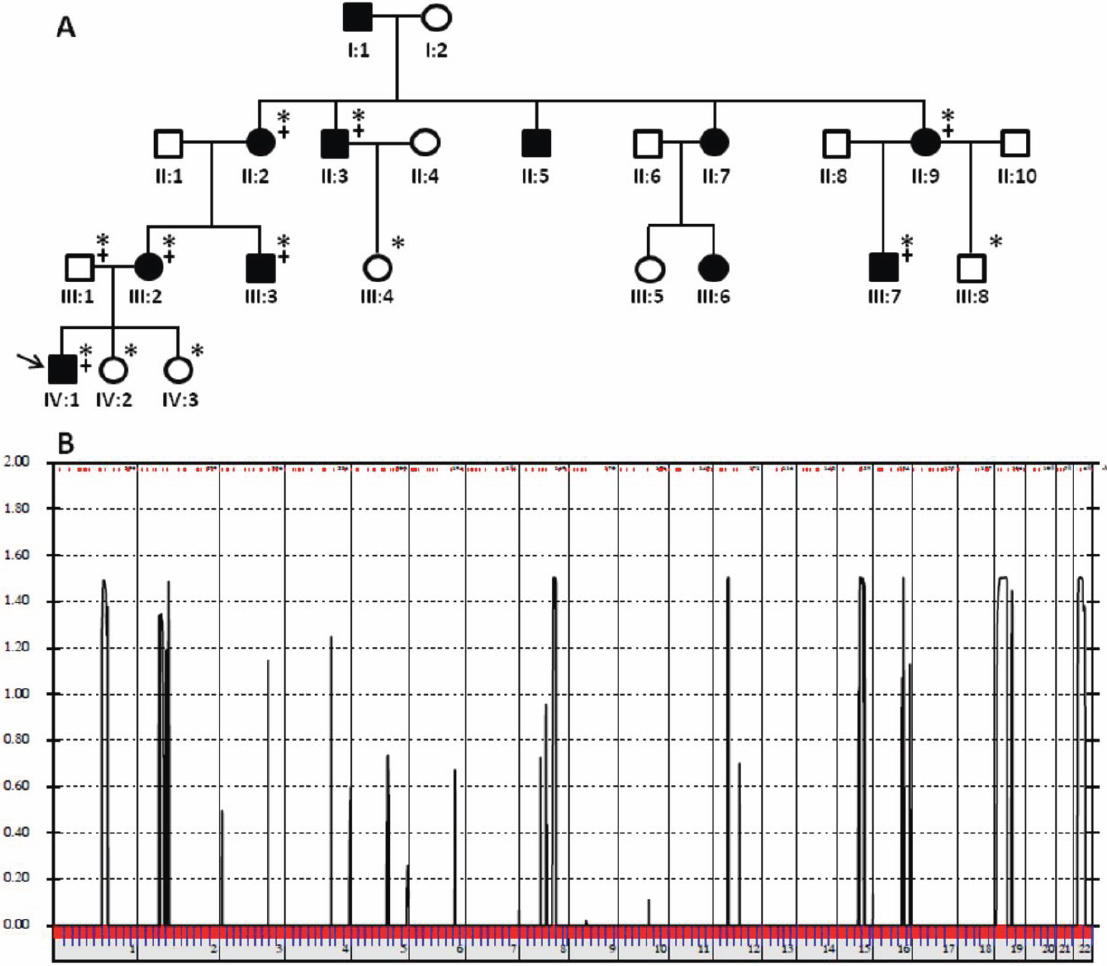
Figure 3. Results of genome-wide linkage analysis.
A: Family pedigree. The family history revealed eleven affected members in four generations. Squares and circles symbolize
males and females, respectively. Clear and blackened symbols denote unaffected and affected individuals. Family members participating
in this study are indicated by an asterisk. Those included in the genome-wide scan are also marked with “+.” The arrow points
to the index patient.
B: Graphical view of multipoint genome-wide LOD scores calculated with ALLEGRO using SNP chip data from family members marked
with “+” on
Figure 3A. The linkage interval on chromosome 22 encompasses the β-crystallin gene cluster.
 Figure 3 of
Weisschuh, Mol Vis 2012; 18:174-180.
Figure 3 of
Weisschuh, Mol Vis 2012; 18:174-180.