Figure 5. SLAT/Def6 KO mice resemble their WT controls in their Treg proportions and activities. A: Immunofluorescence analyses of lymph node cells in which the proportion of cells expressing FoxP3 was determined by gating
on whole lymph node cells, or on the CD4 population. B: The Treg functional activity of the KO mice is similar to that of the WT controls.
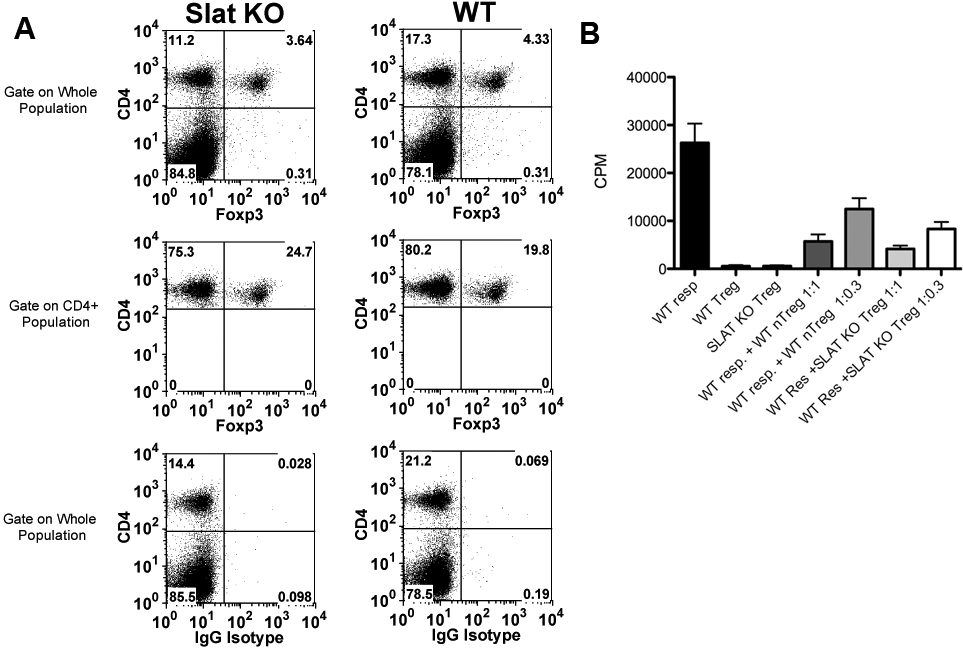
 Figure 5 of
Vistica, Mol Vis 2012; 18:1858-1864.
Figure 5 of
Vistica, Mol Vis 2012; 18:1858-1864.