Figure 3. Homozygosity mapping
results. A: Plot of homozygous regions identified in
affected individuals in family A using Homozygosity Mapper
analysis. B: Plot of homozygous regions identified in
affected individuals in family B using Homozygosity Mapper
analysis. The red lines indicate homozygous regions shared by
affected individuals in each family. The arrows indicate the
homozygous regions that harbor RDH5.
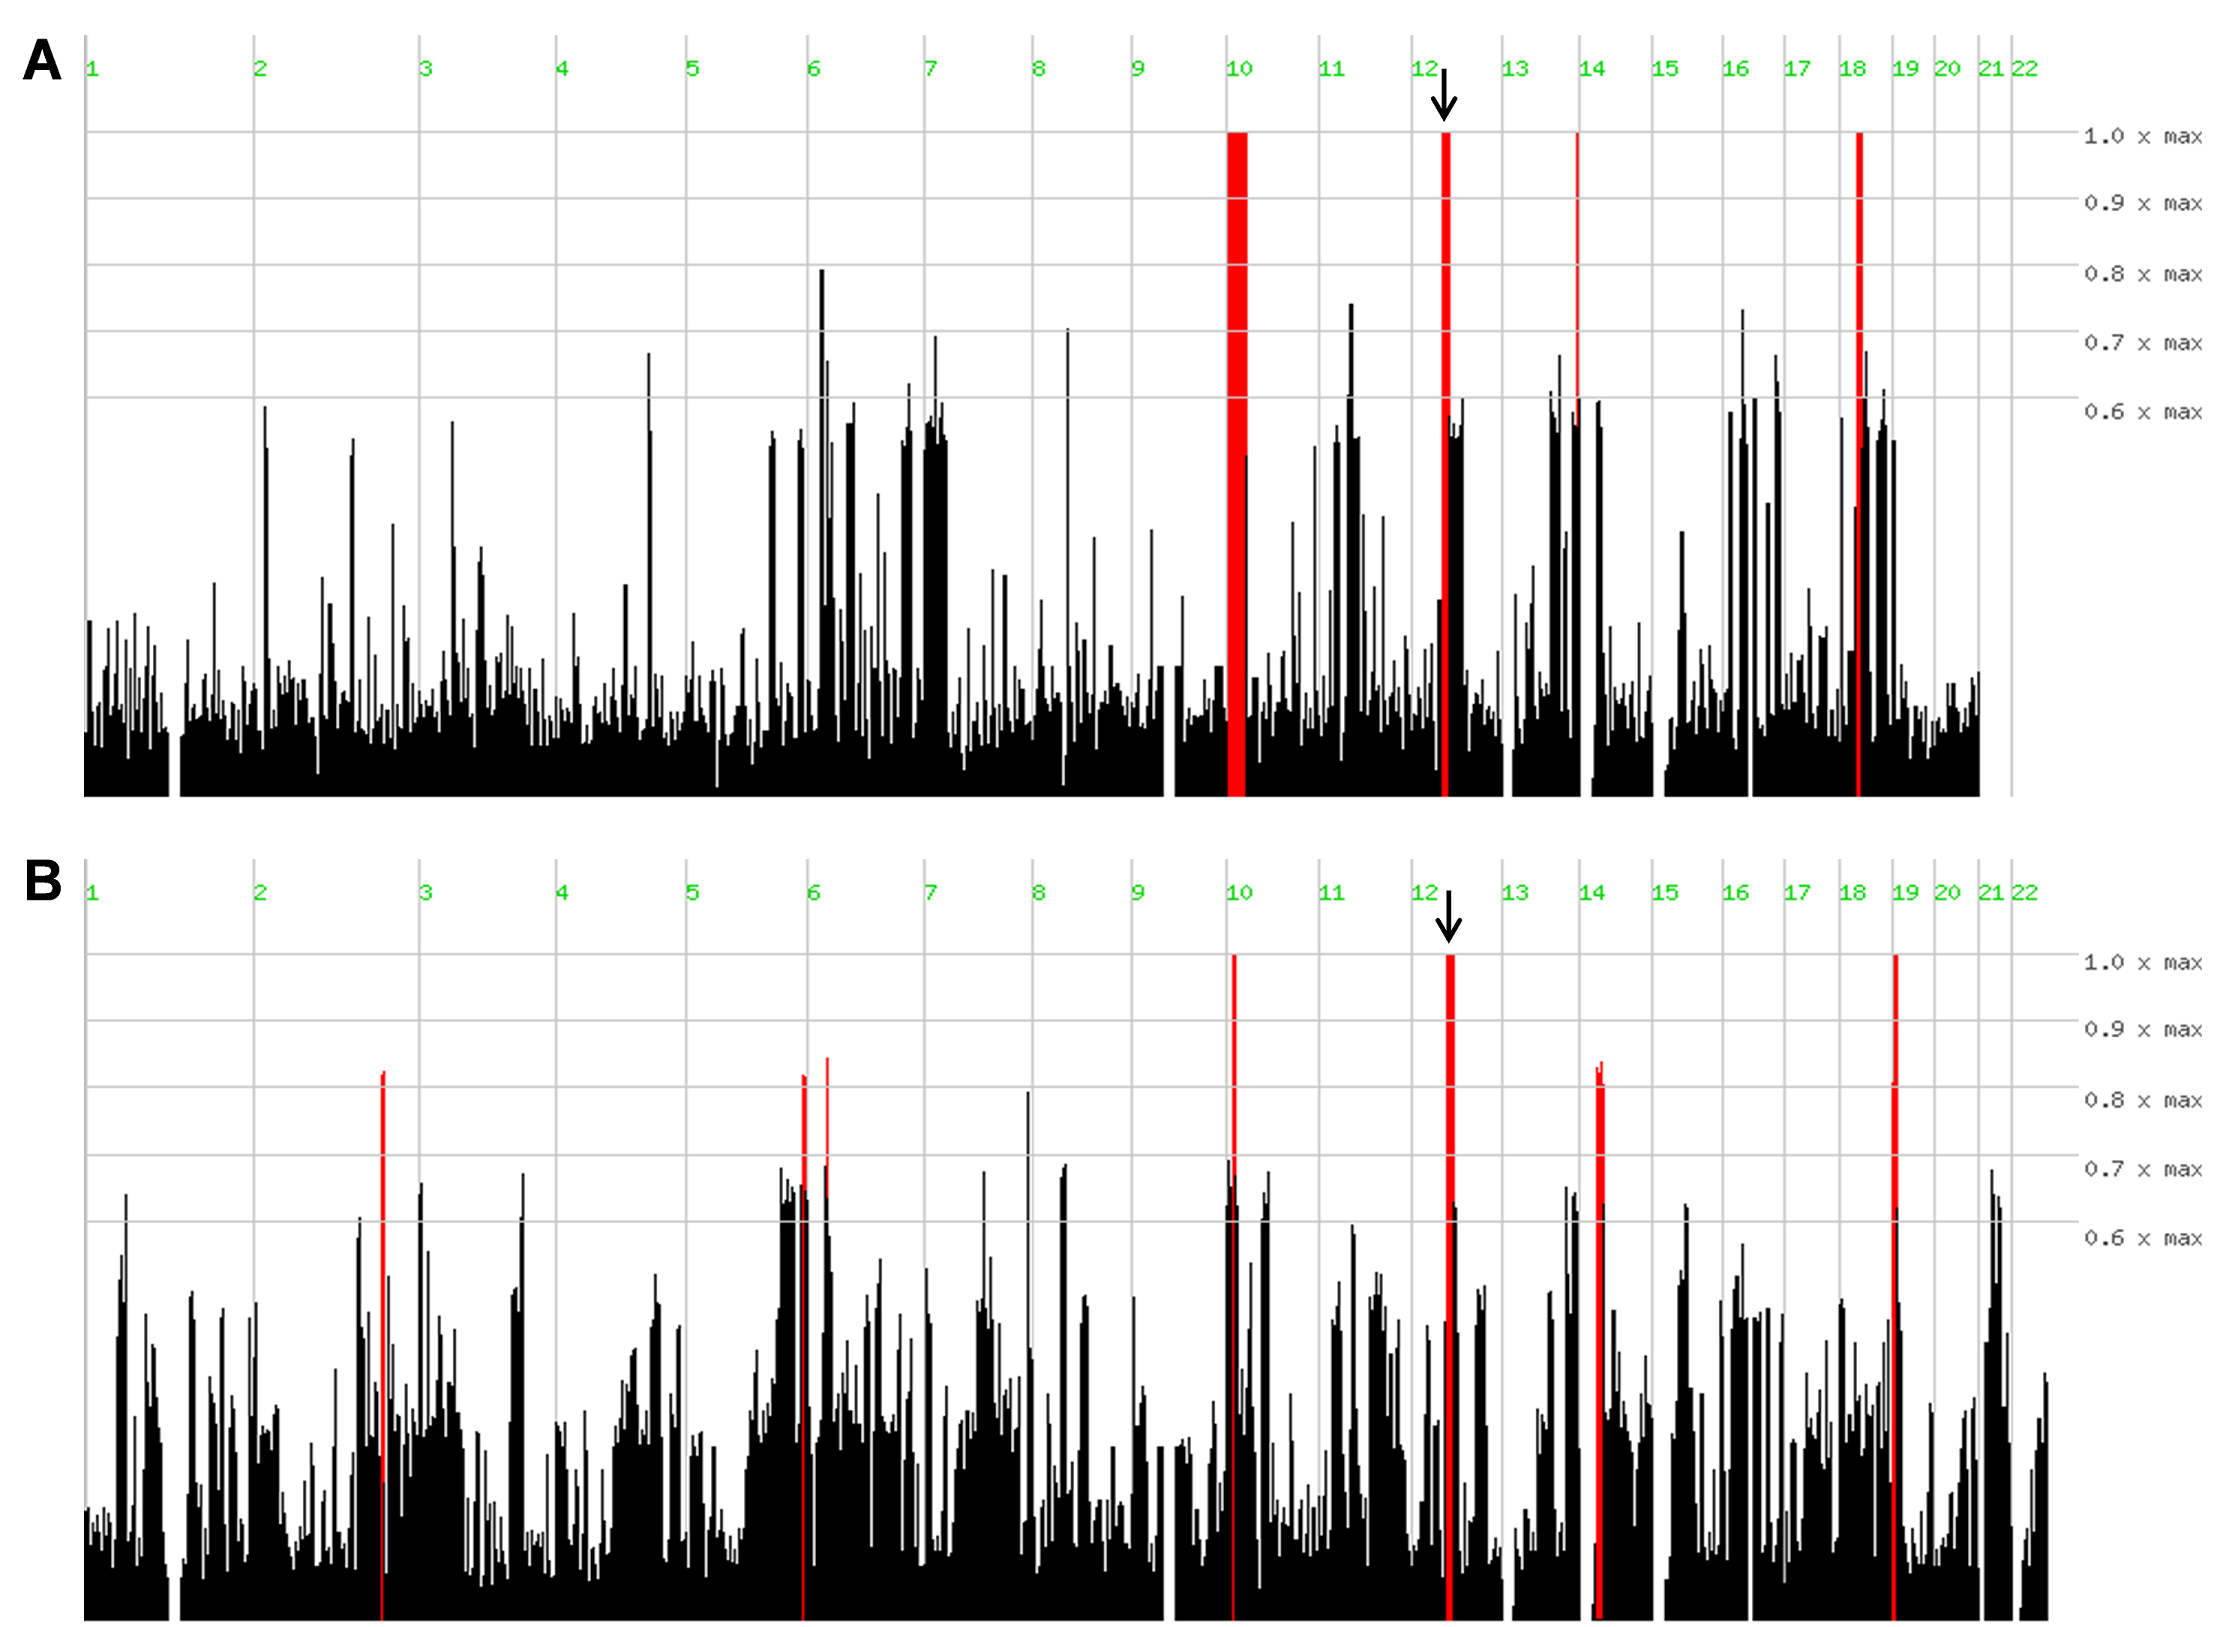
 Figure 3
of Ajmal, Mol Vis 2012; 18:1558-1571.
Figure 3
of Ajmal, Mol Vis 2012; 18:1558-1571.