Figure 1. Pedigrees and sequencing
results. A: Segregation of the mutation in family A. B:
Segregation of the mutation in family B. C and D:
Sequence electropherograms of affected individuals carrying
homozygous variants (upper panels) and unaffected heterozygous
carriers (middle panels) of families A (C) and B (D),
along with the results of a control individual (wild-type [wt],
lower panels). Arrows point to the probands; individuals tested
with single nucleotide polymorphism (SNP) microarrays are
indicated with asterisks.
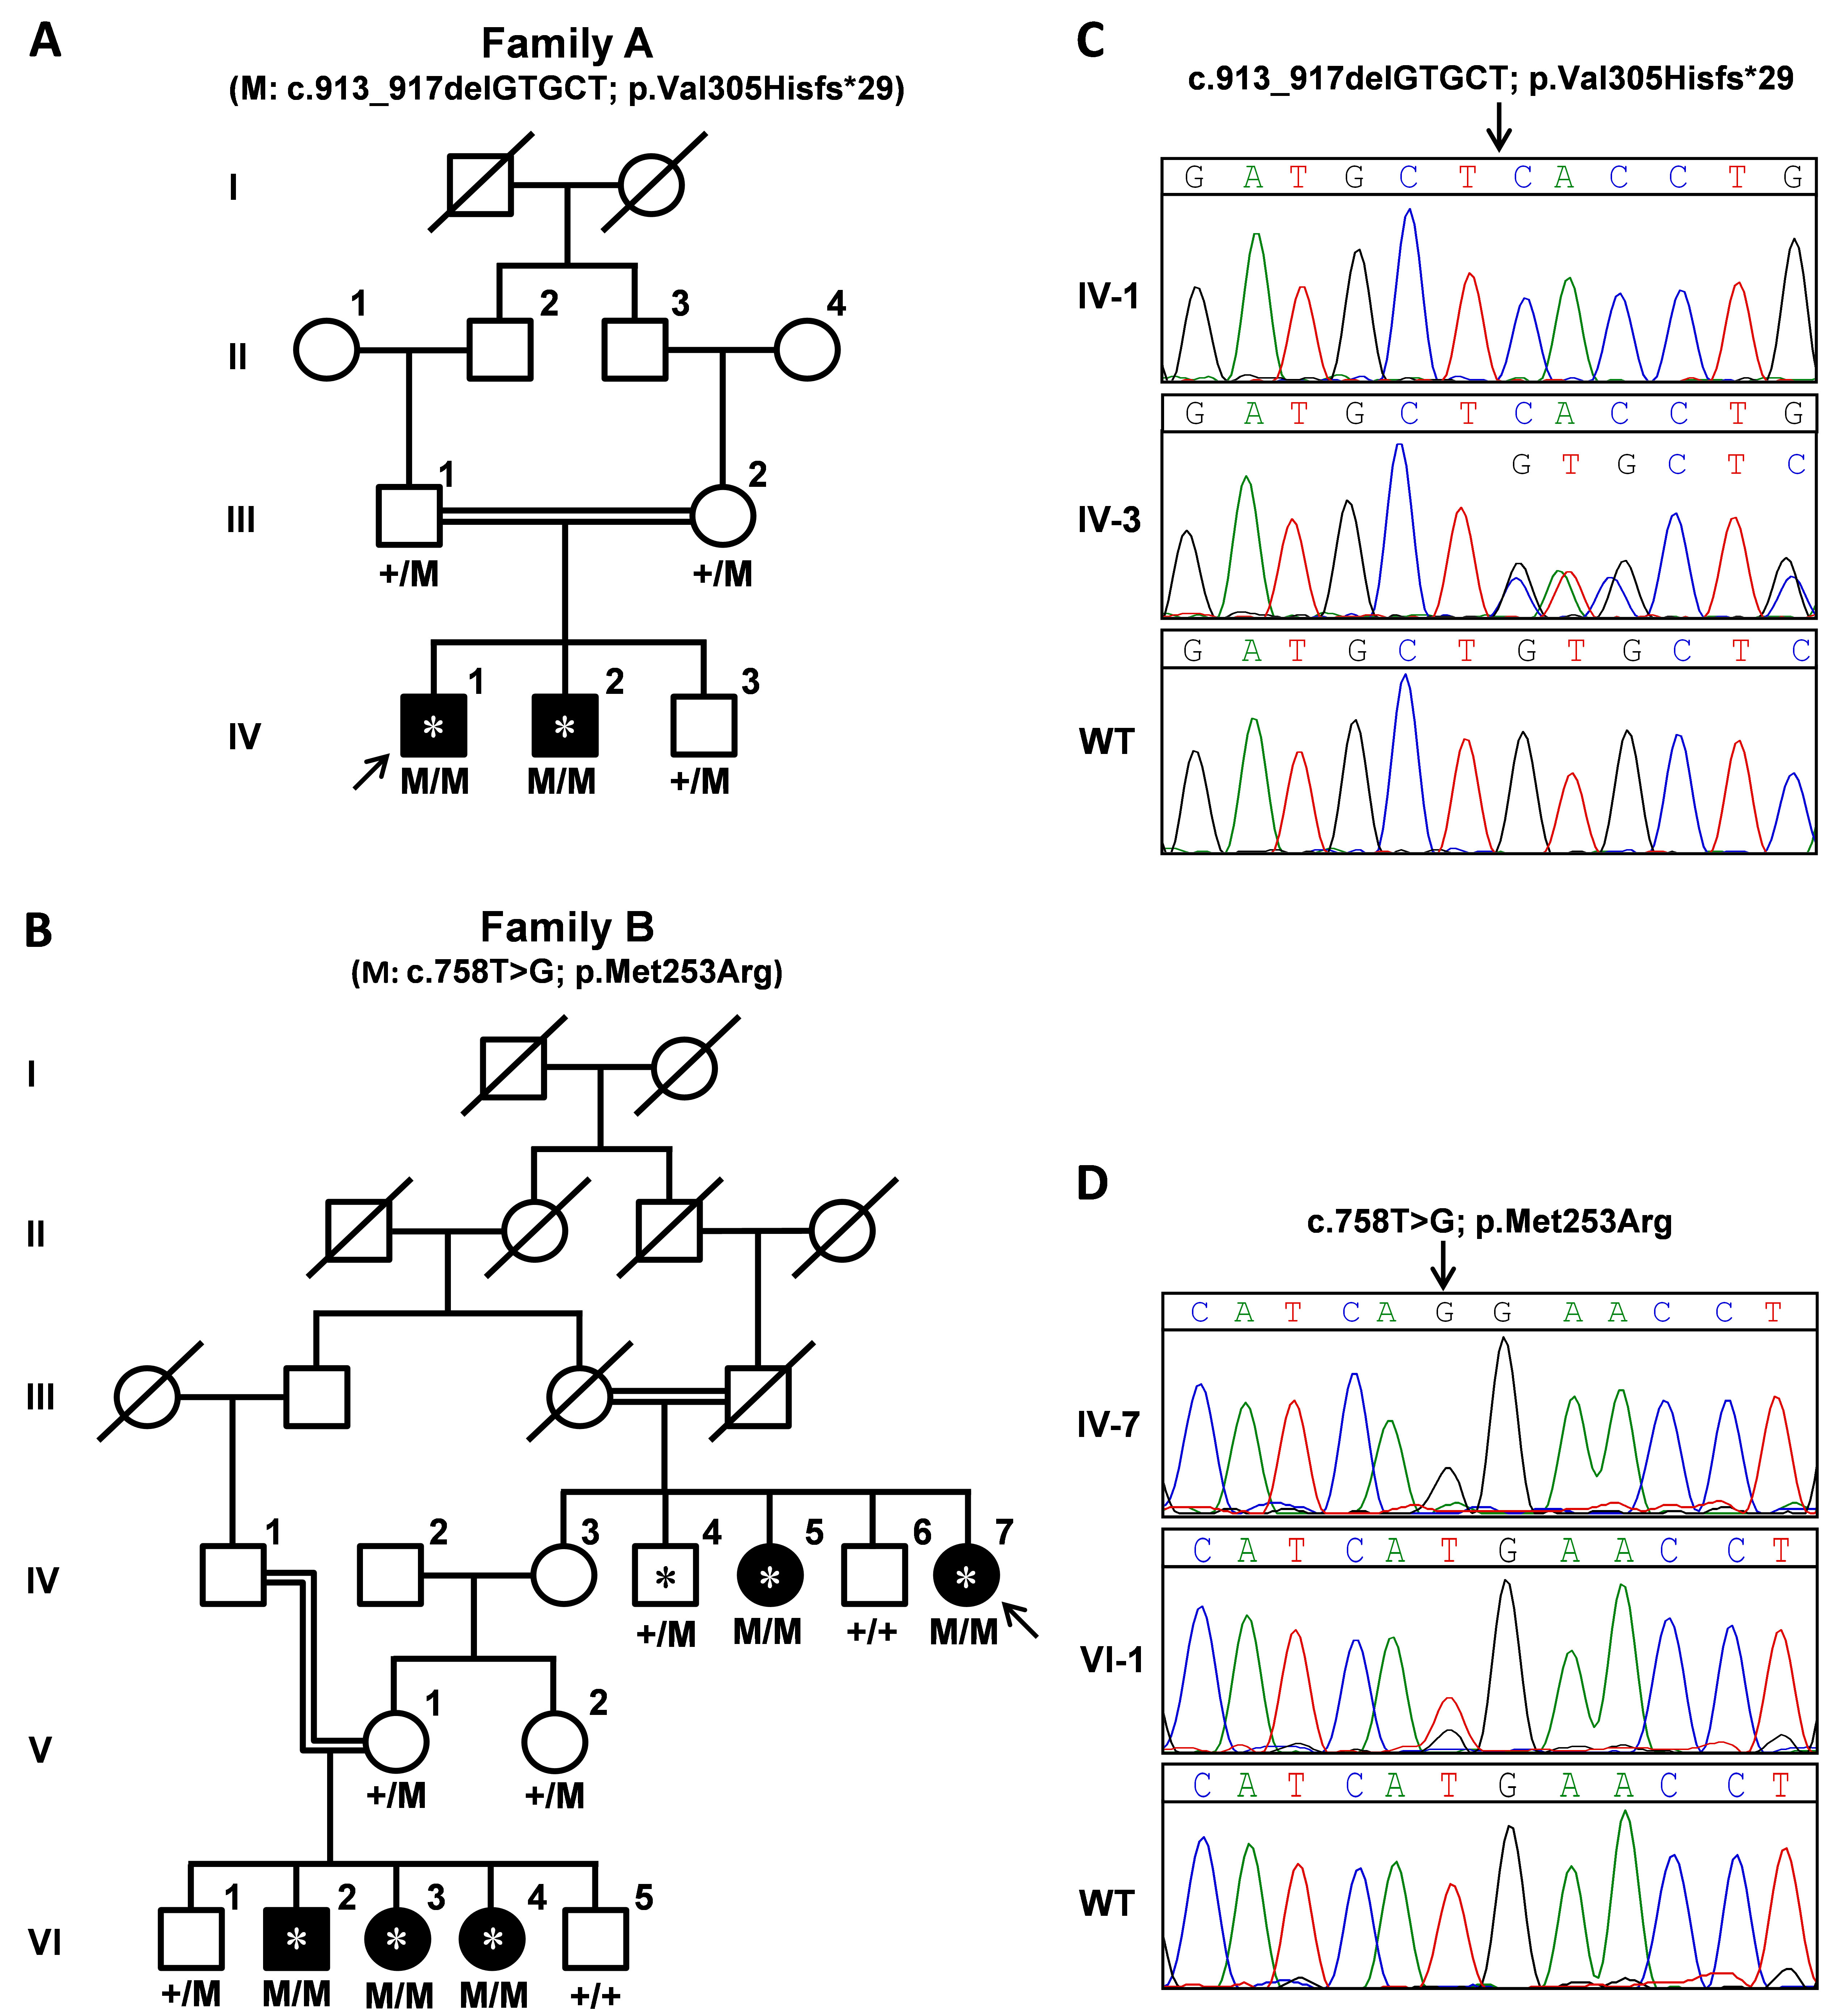
 Figure 1
of Ajmal, Mol Vis 2012; 18:1558-1571.
Figure 1
of Ajmal, Mol Vis 2012; 18:1558-1571.