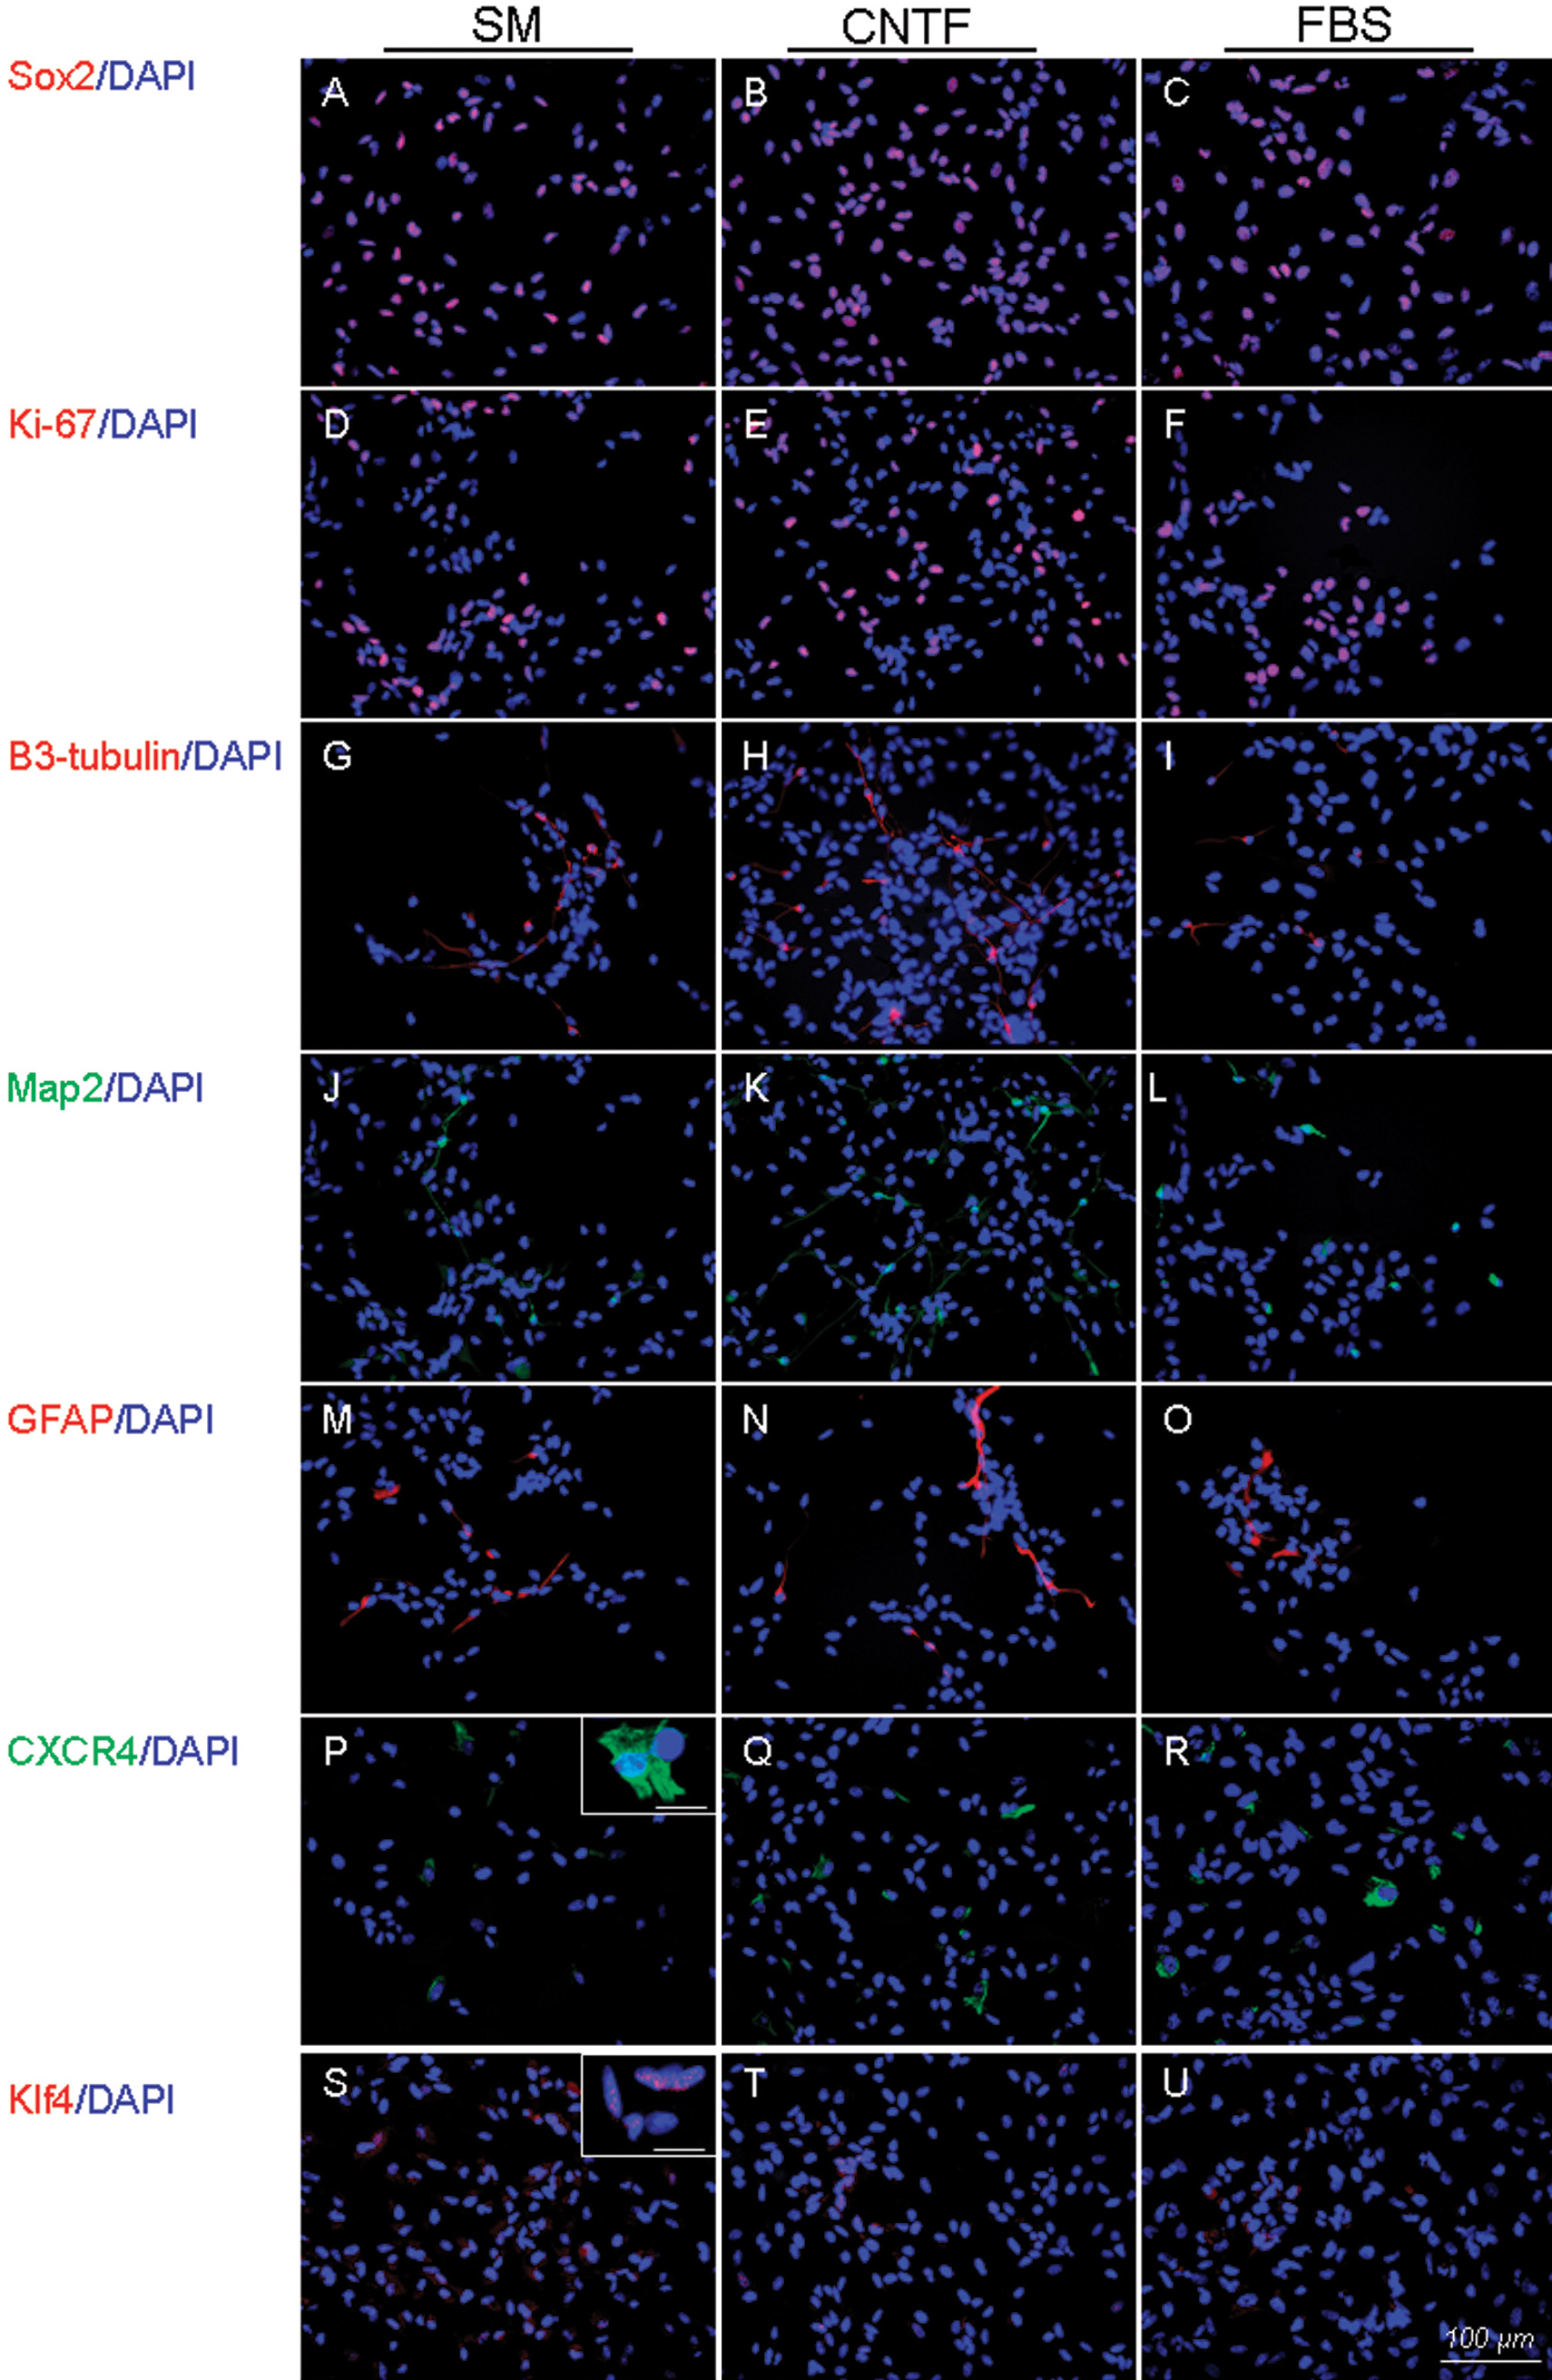
Figure 9. Changes in selected marker
proteins showing changes in relative expression levels for each
treatment condition. This figure expands on the
immunocytochemical data presented in
Figure 8 by showing the
results obtained for the same seven markers under baseline
proliferation (standard medium [SM]) conditions (
A,
D,
G,
J,
M,
P,
S), as
previously shown, together with the ciliary neurotrophic factor
(CNTF;
B, E,
H,
K,
N,
O,
T) and ftela bovine serum (FBS;
C,
F,
I,
L,
O,
R,
U) treatment conditions
for comparison. Markers are listed to the left of the data,
treatment above. Scale bar: 100 µm.
 Figure 9
of Yang, Mol Vis 2012; 18:1484-1504.
Figure 9
of Yang, Mol Vis 2012; 18:1484-1504.