Figure 8. Changes in protein
expression were identified using immunocytochemical analysis.
Expression of seven selected markers were confirmed as proteins.
Markers examined included Sox2 (A), Ki-67 (B),
β3-tubulin (C), Map2 (D), glial markers glial
fibrillary acidic protein (GFAP; E), Krüppel-like factor
4 (KLF4; F), and C-X-C chemokine receptor type 4 (CXCR4;
G). Insets provide higher power images of labeled
profiles to illustrate labeling patterns. Photomicrographs
showing labeling for each marker under standard medium (SM),
ciliary neurotrophic factor (CNTF), and fetal bovine serum (FBS)
conditions from left to right, respectively. Insets in F
and G provide higher power images of labeled profiles,
to illustrate labeling patterns. In addition, results after 24 h
treatment were compared across treatment conditions as shown in
the accompanying histograms. In each case, untreated cultures in
SM are represented by the left bar, the CNTF-based condition by
the center bar, and the FBS-based condition by the right bar.
Error bars show standard deviation (SD); asterisks (*) denote
statistical significance (p<0.05). Scale bar: 100 µm.
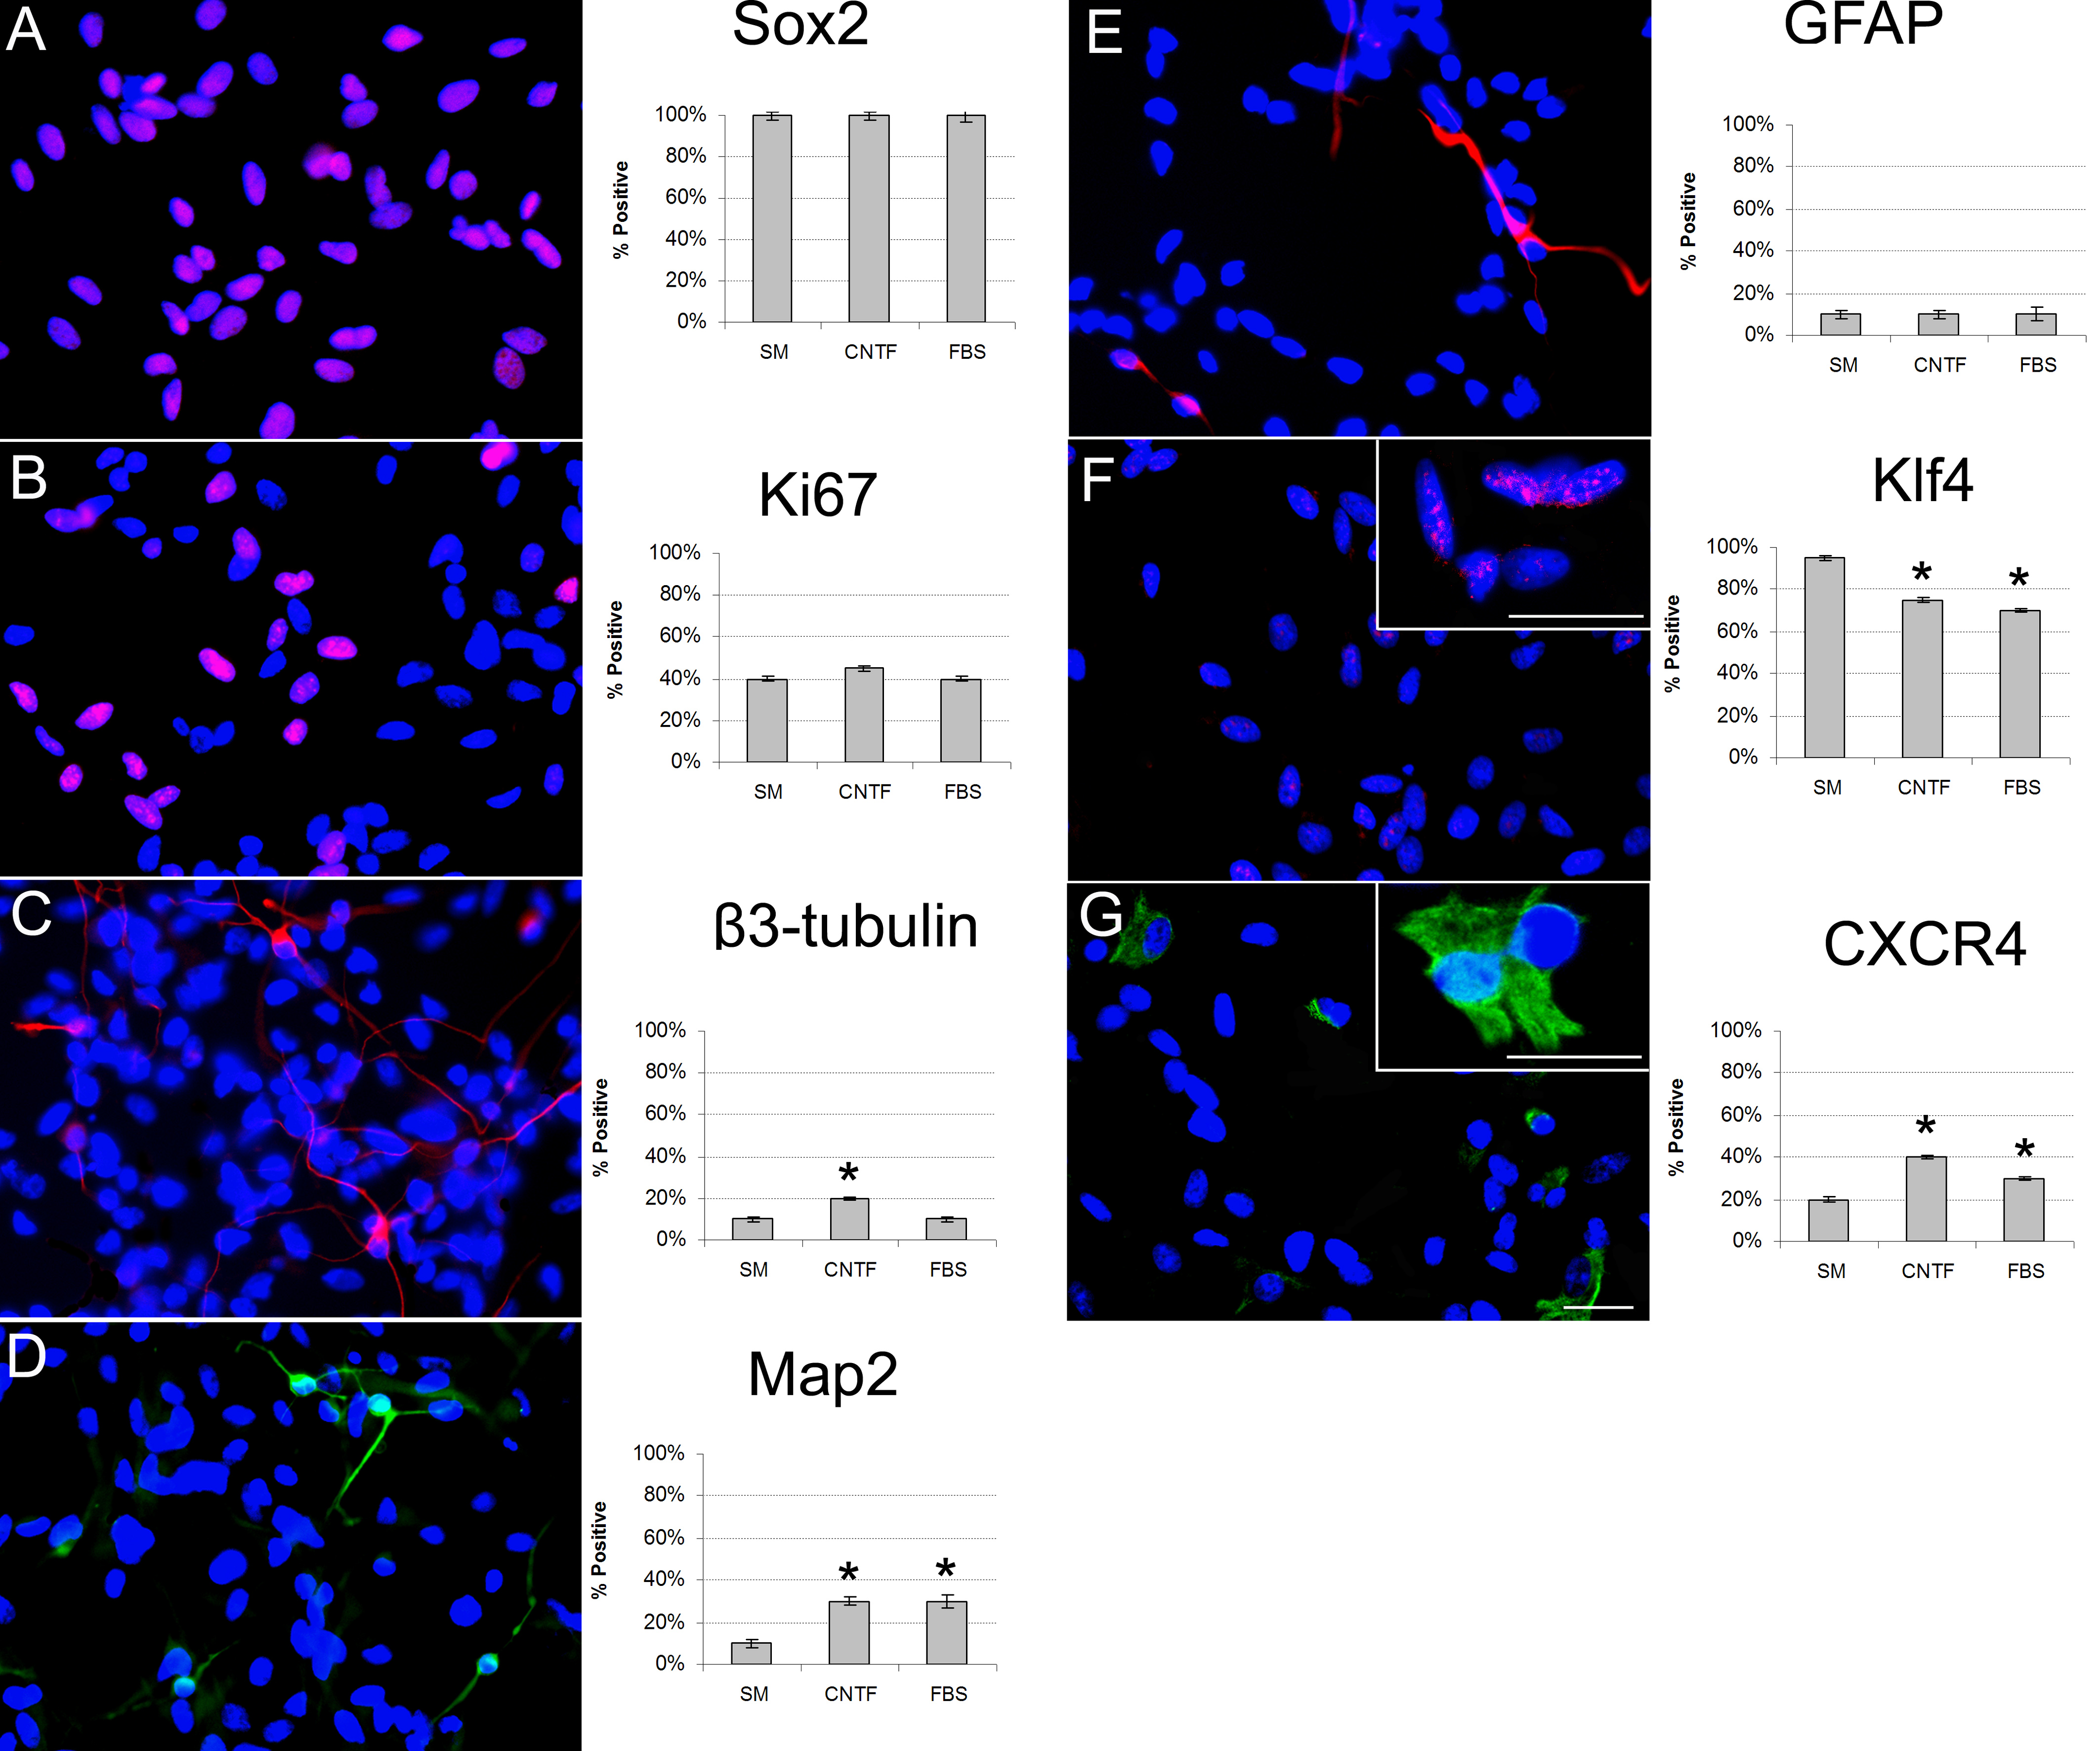
 Figure 8
of Yang, Mol Vis 2012; 18:1484-1504.
Figure 8
of Yang, Mol Vis 2012; 18:1484-1504.