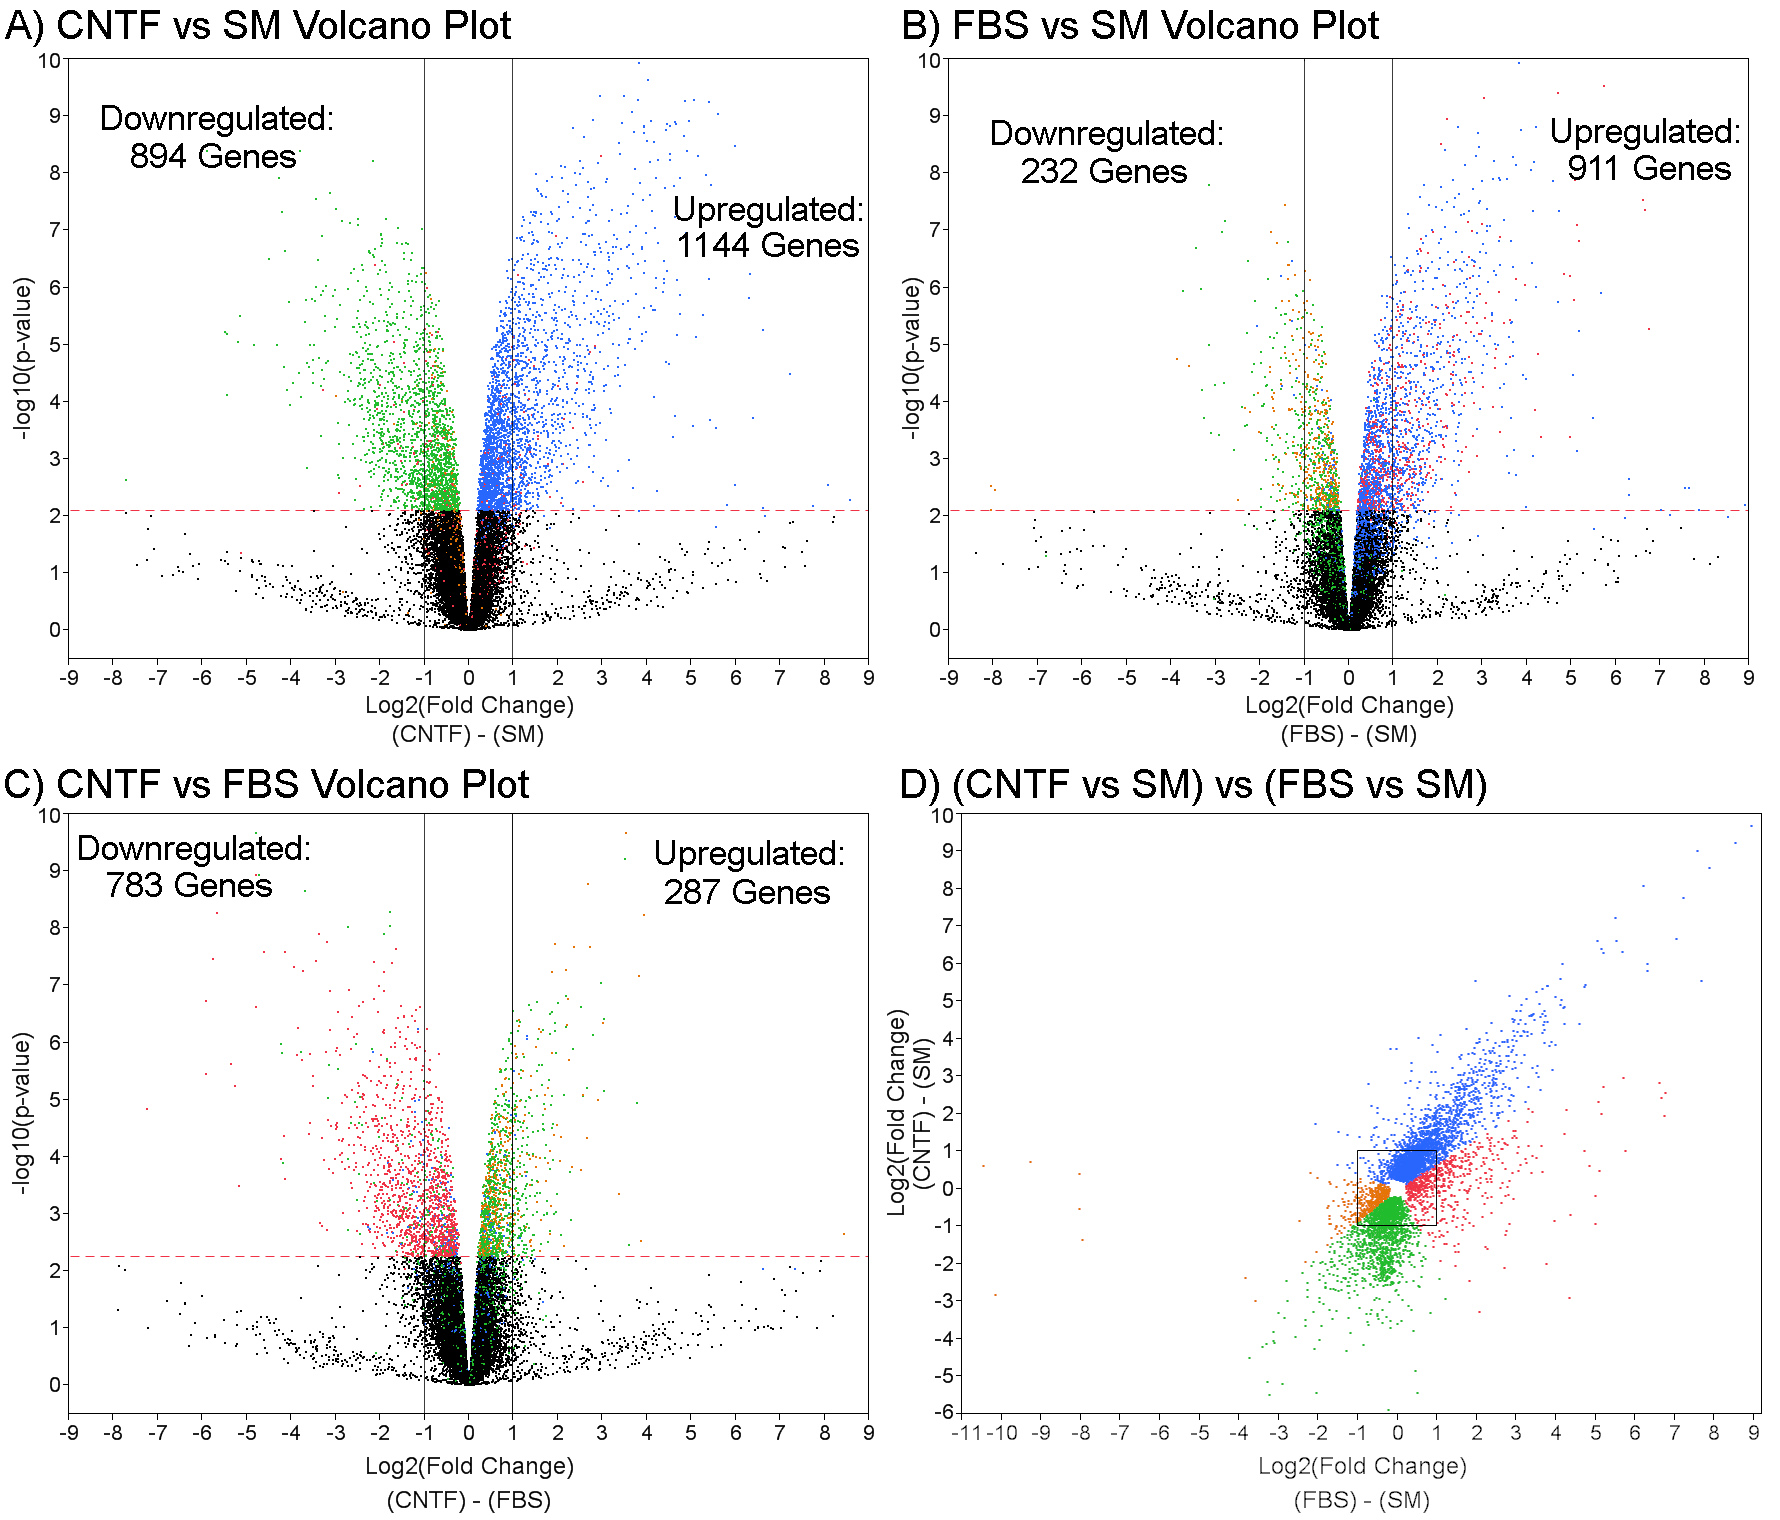
Figure 4. The use of volcano plots
allows for comparison between conditions. Volcano plot displays
of genes significantly upregulated and downregulated as a result
of different treatments:
A: Ciliary neurotrophic factor
(CNTF)-based conditions using standard medium (SM) as baseline,
(
B) fetal bovine serum (FBS)-based conditions using SM as
baseline, and (
C) CNTF using FBS as baseline (
C).
With an false discovery rate (FDR) multiple test correction of
α<0.05, the p-value cutoff (indicated by red dashed line) was
p<.00794424 in (
A) and (
B), and was
p<0.00554170 in (
C). The lines drawn at −1 and 1 show
the log2 cutoff for significant fold change in
A-
C.
D: Comparison of significantly changed genes for CNTF and
FBS treatments, using SM as a control in both cases. The box in
(
D) is the log2 cutoff for fold change significance. The
colors of the data points correspond to the hierarchical cluster
analysis in
Figure
3 and therefore illustrate the direction of
expression changes for genes in those clusters, relative to
treatment condition.
 Figure 4
of Yang, Mol Vis 2012; 18:1484-1504.
Figure 4
of Yang, Mol Vis 2012; 18:1484-1504.