Figure 3. Heat map analysis revealed
that the 5,666 genes exhibiting statistically significant
changes in expression level (false discovery rate [FDR]
α<0.05) could be clustered into one of four groups. Genes
from the Jak/STAT, Wnt, and Notch pathways are shown relative to
positioning in the relevant clusters, along with arrows next to
each gene name indicating if the gene is upregulated or
downregulated. Asterisk (*) indicates significant fold change
(|fold change|>2).
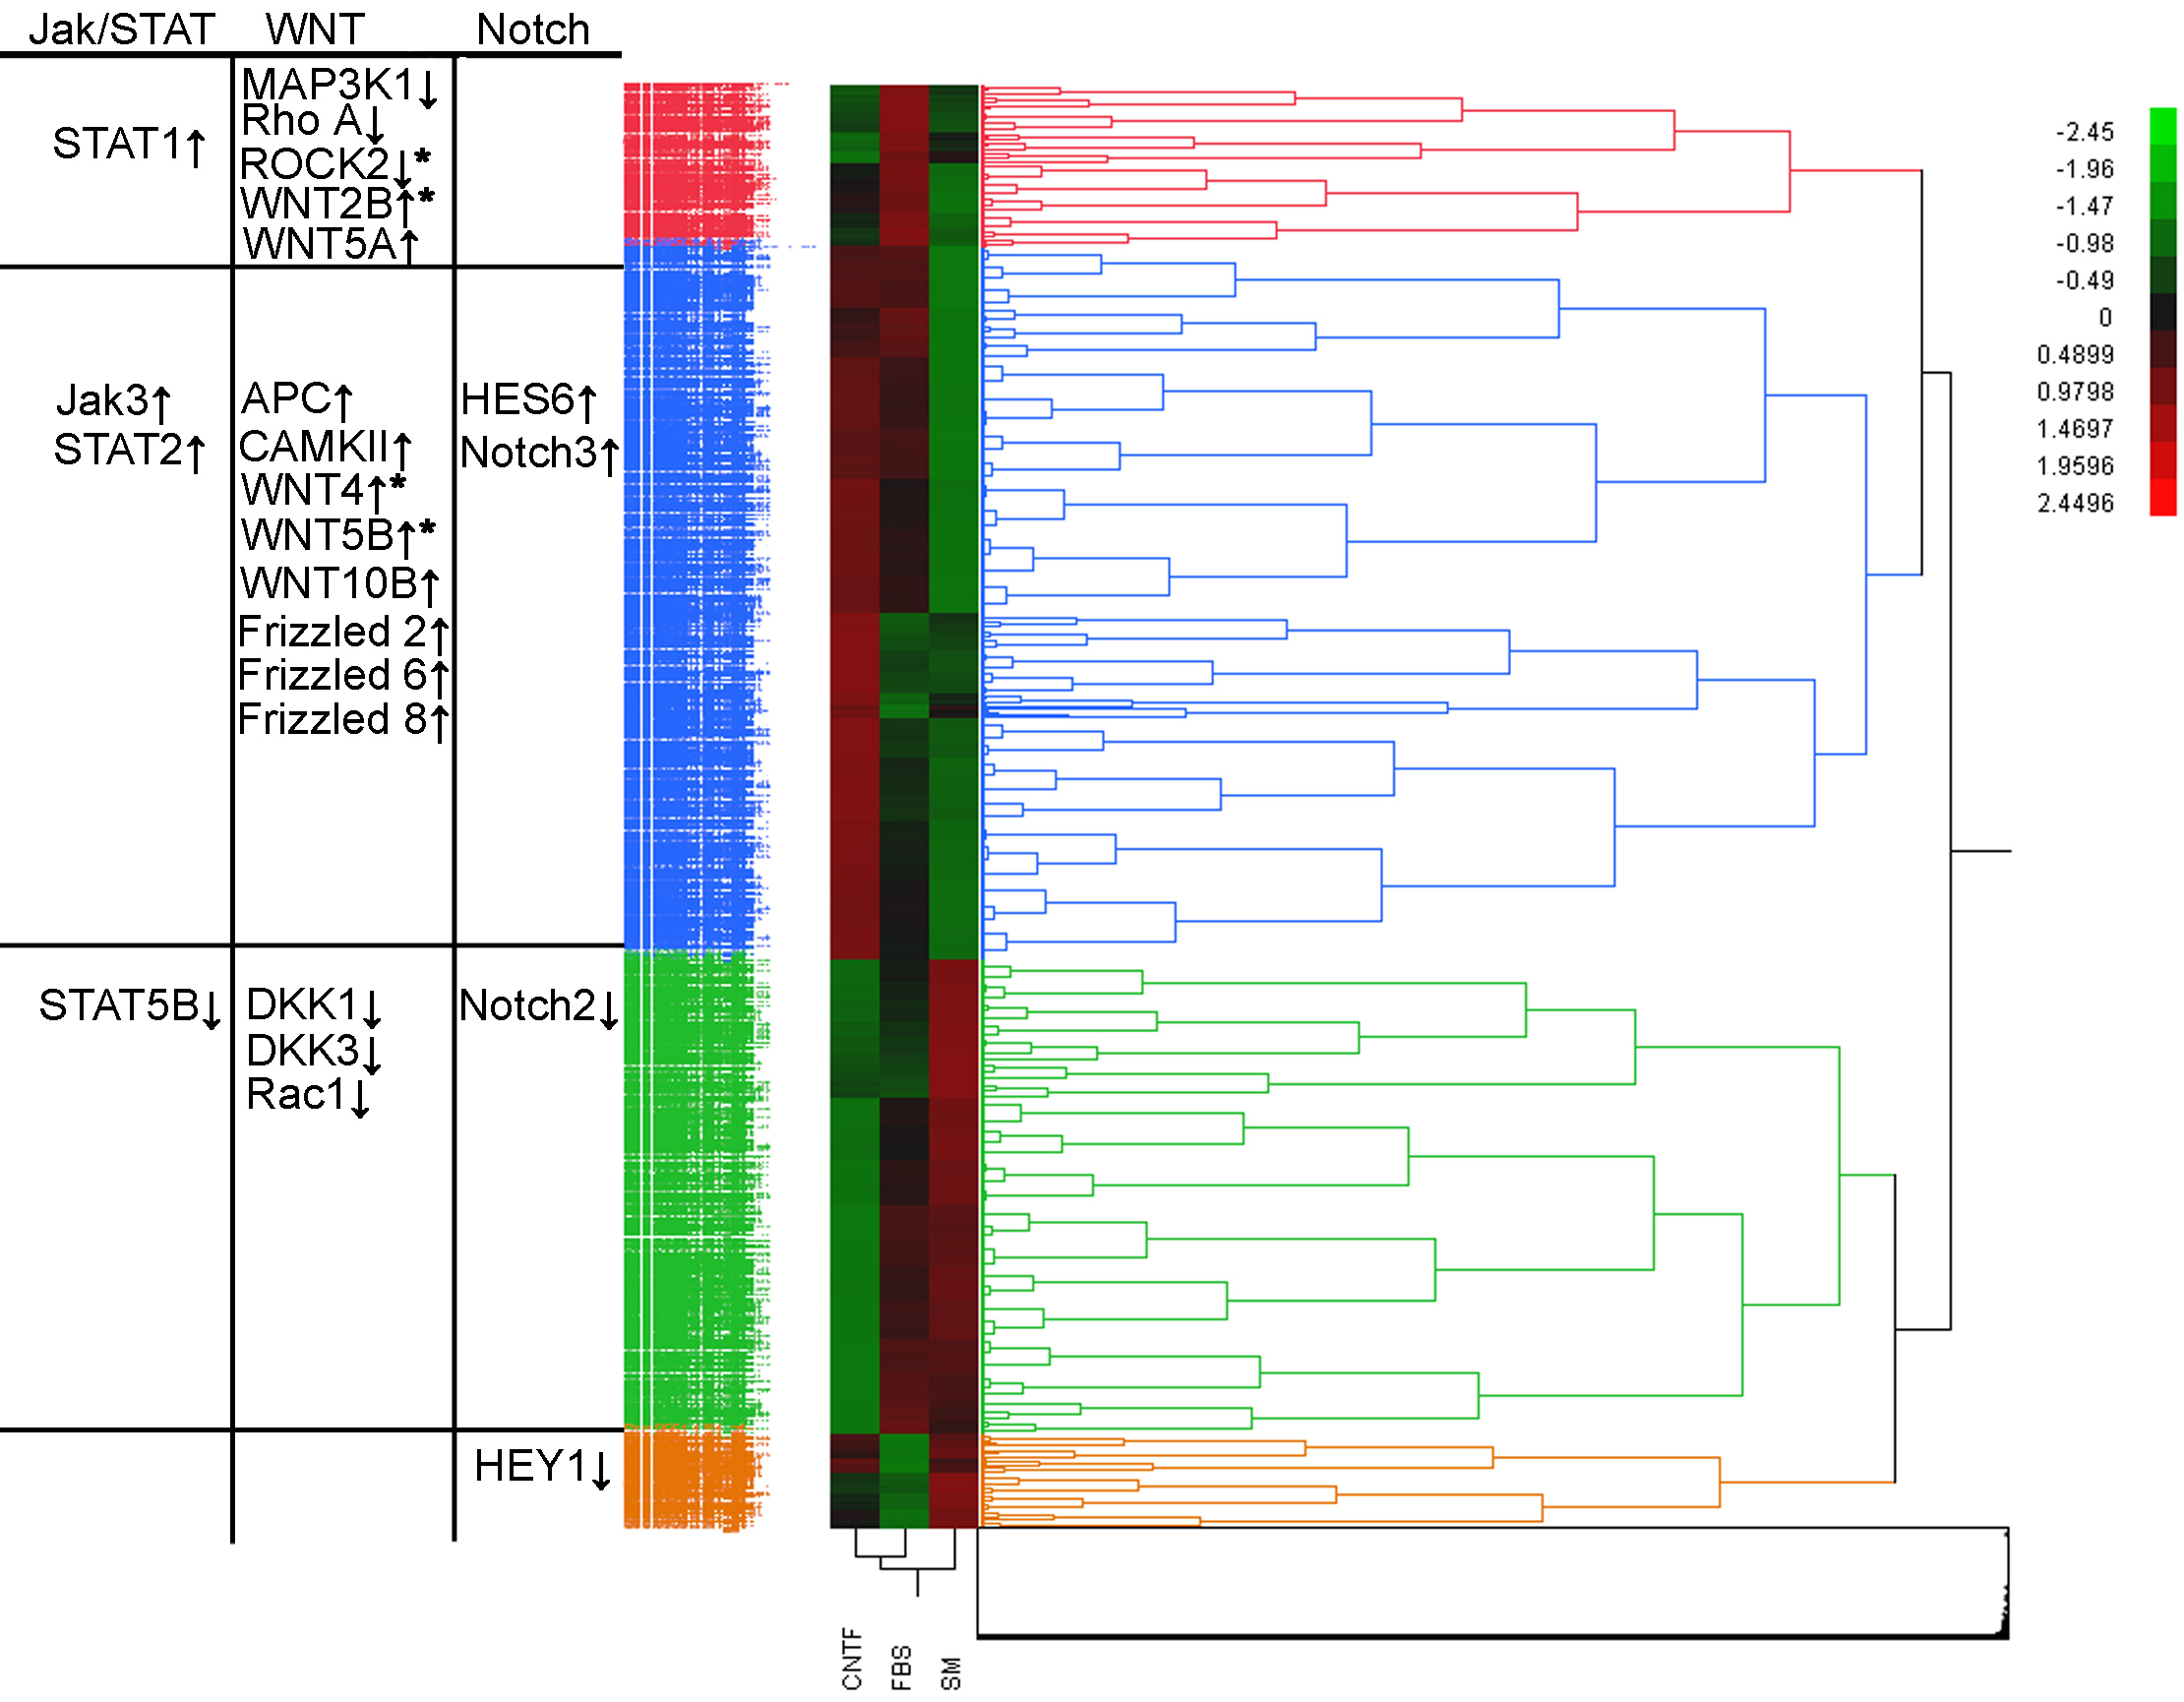
 Figure 3
of Yang, Mol Vis 2012; 18:1484-1504.
Figure 3
of Yang, Mol Vis 2012; 18:1484-1504.