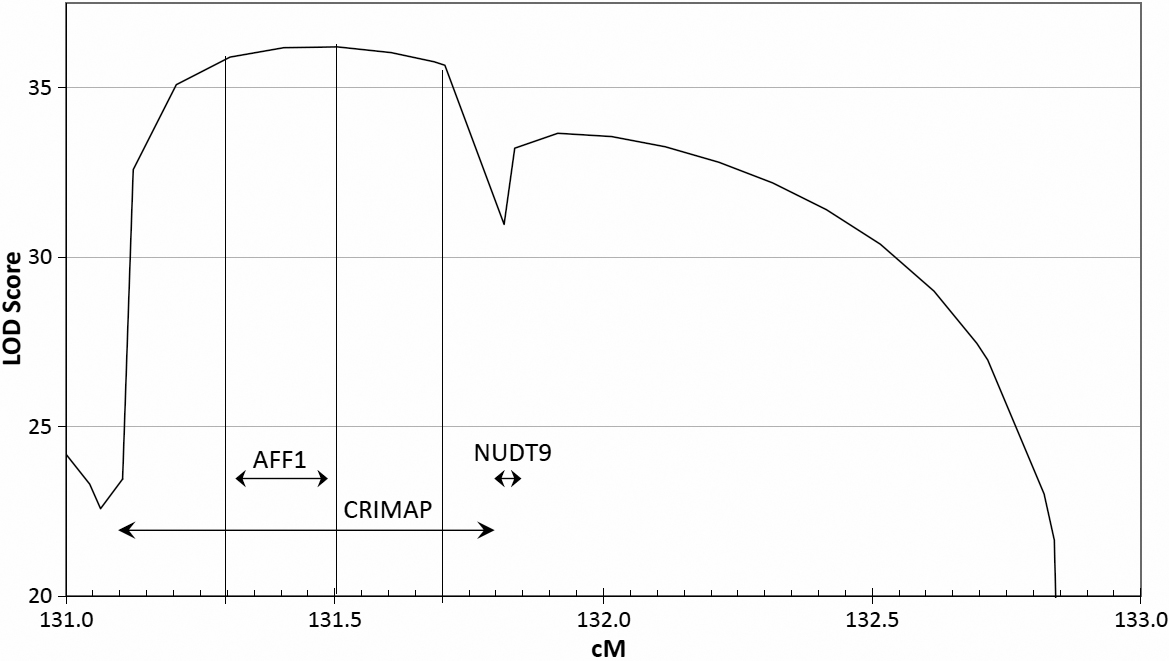
Figure 5. Close-up of
Figure 3.
The boundaries of the 1-LOD support interval and the point with
the highest LOD score are shown by vertical lines as in
Figure 3.
CRIMAP
shows most likely interval between two markers to contain the
OHC locus, from the latest
CRIMAP
analysis using the same data as the multipoint analysis.
AFF1
and
NUDT9 show the boundaries of those genes, taken from
the
Oar1.0
physical map and interpolated to the linkage map.
 Figure 5
of Wilson, Mol Vis 2012; 18:1384-1394.
Figure 5
of Wilson, Mol Vis 2012; 18:1384-1394.