Figure 3. Multipoint linkage analysis of the candidate OHC region. This analysis is based on the genotypes of 11 markers in 296 animals,
plus the genotypes of 12 more markers in 48 of the 296 animals. The three vertical lines indicate the 1-LOD support interval
and the highest LOD score within it. Markers are indicated by vertical text along the bottom, and some have been omitted.
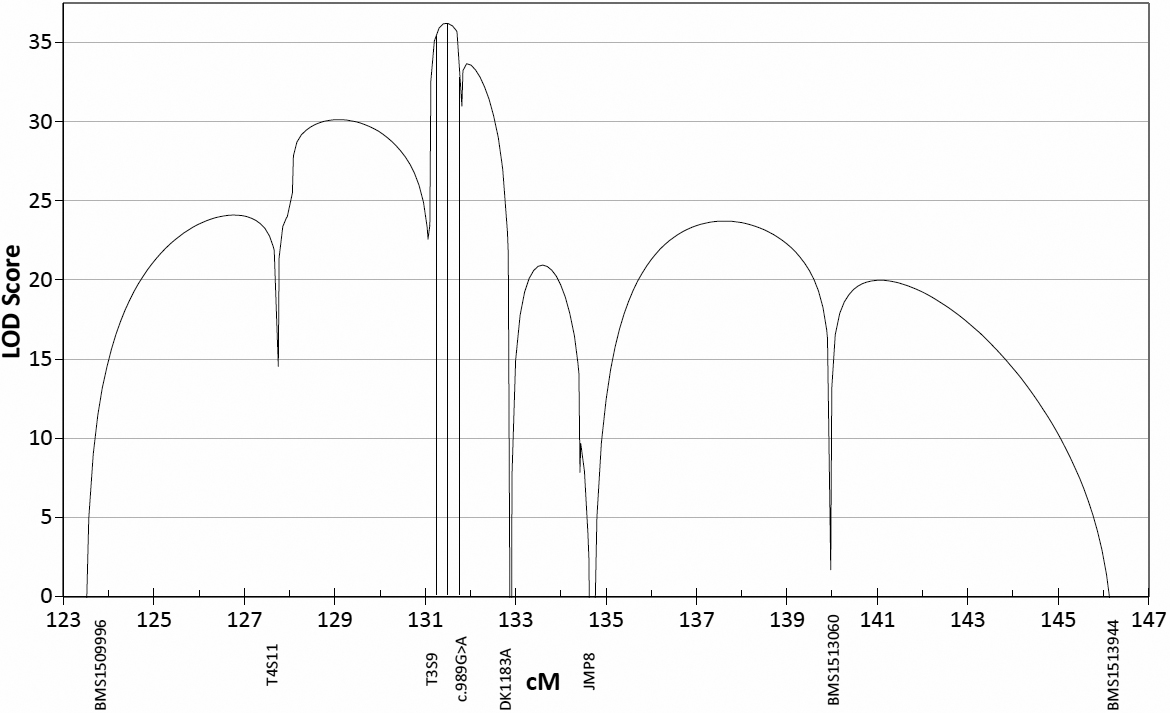
 Figure 3 of
Wilson, Mol Vis 2012; 18:1384-1394.
Figure 3 of
Wilson, Mol Vis 2012; 18:1384-1394.