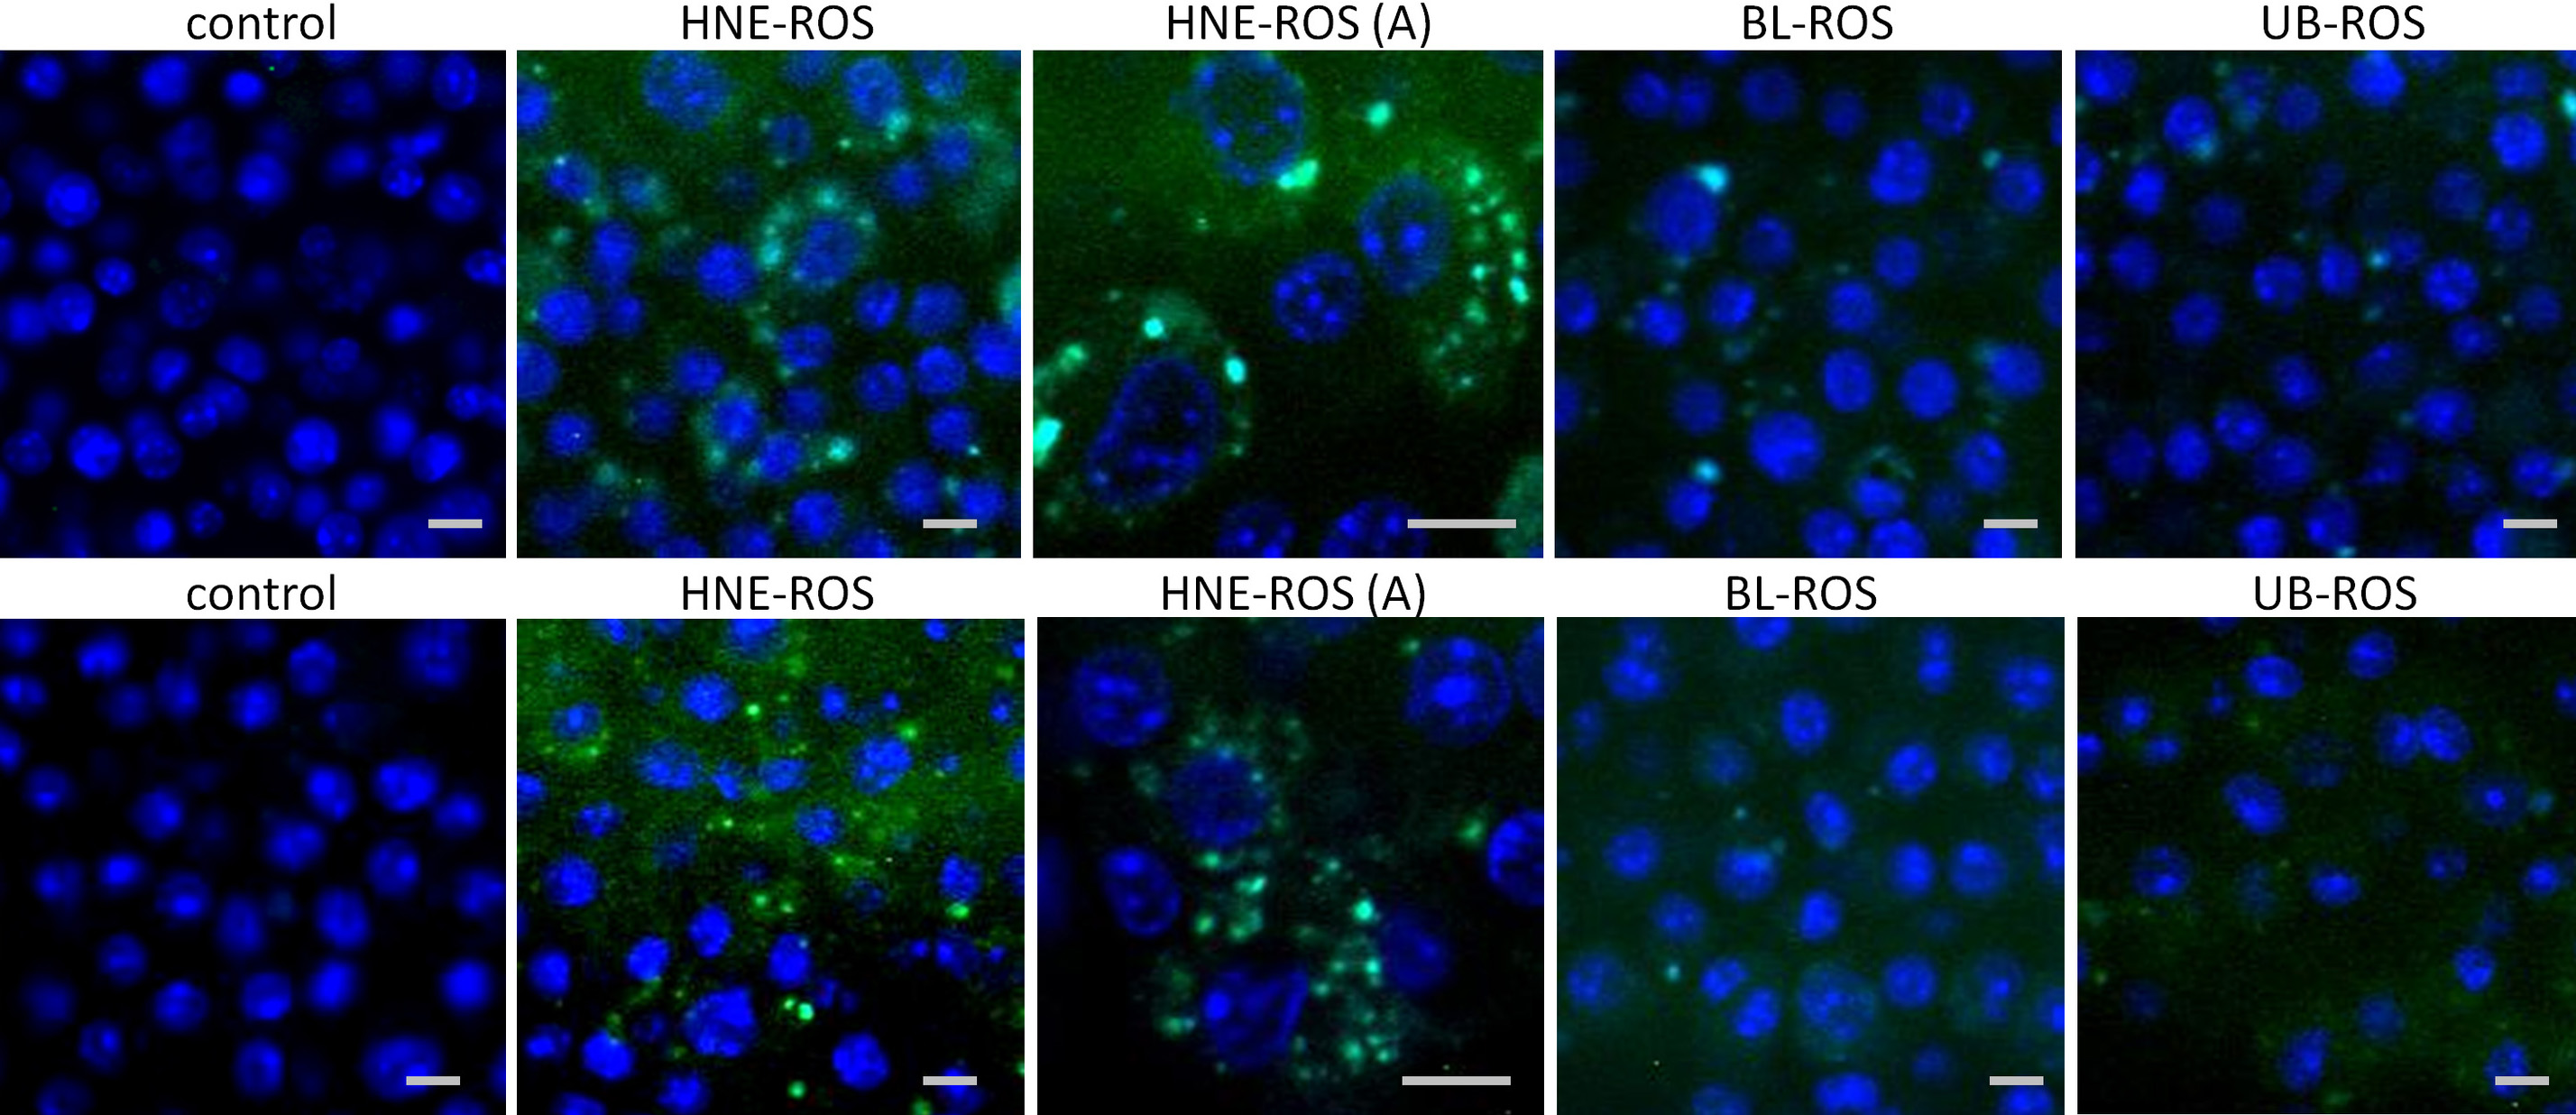
Figure 3. Confocal microphotographs
of macrophages and microglial cells after 4 day feeding with
different rod outer segments (ROS). Shown are laser-scanning
confocal micrographs of macrophages and microglial cells fed
with different ROSs. Microglial cells fed with no ROSs
(control), bleached ROSs, unbleached ROSs, and HNE-modified ROSs
are presented on the top row. Macrophages tested under the same
conditions are presented on the bottom row. Each group
demonstrates different extents of green-yellow autofluorescence
at the FITC channel (excitation, 488 nm; detection, 530 nm).
Panels marked as “HNE-ROS (A)” (middle panels) indicate
microphotographs of cells fed with HNE-modified ROSs taken at an
original magnification of 400×. All other photographs were taken
with original magnification 200×. Scale bar=10 μm. Abbreviations
are the same as in
Figure 2.
 Figure 3
of Lei, Mol Vis 2012; 18:103-113.
Figure 3
of Lei, Mol Vis 2012; 18:103-113.