Figure 2. Autofluorescence of
macrophages and microglial cells after 4 day feeding with
different rod outer segments (ROSs). A: This is a
fluorescence-activated cell sorting (FACS) analysis of the
fluorescein isothiocyanate (FITC) channel (detection filter,
533/30 nm) of the microglial cells (left panel) and macrophage
cells (right panel) fed with different ROSs. Note the large
increase of AF in cells fed with modified rod outer segments
(HNE-ROSs) compared to the other two groups. B: FACS
analysis in the PE channel (detection filter, 585/40 nm) of the
microglial cells (left panel) and macrophage cells (right panel)
fed with different ROSs. Note the slight increase in the
bleached ROS group and the decrease in HNE-ROSs compared to the
corresponding AF registering at 533 nm. Abbreviation key:
BL-ROSs=bleached rod outer segments; UB-ROSs=unbleached rod
outer segments. Each bar reflects the average value obtained
from nine samples. Asterisks indicate statistical significance
(one sample t-test; ***=p<0.001).
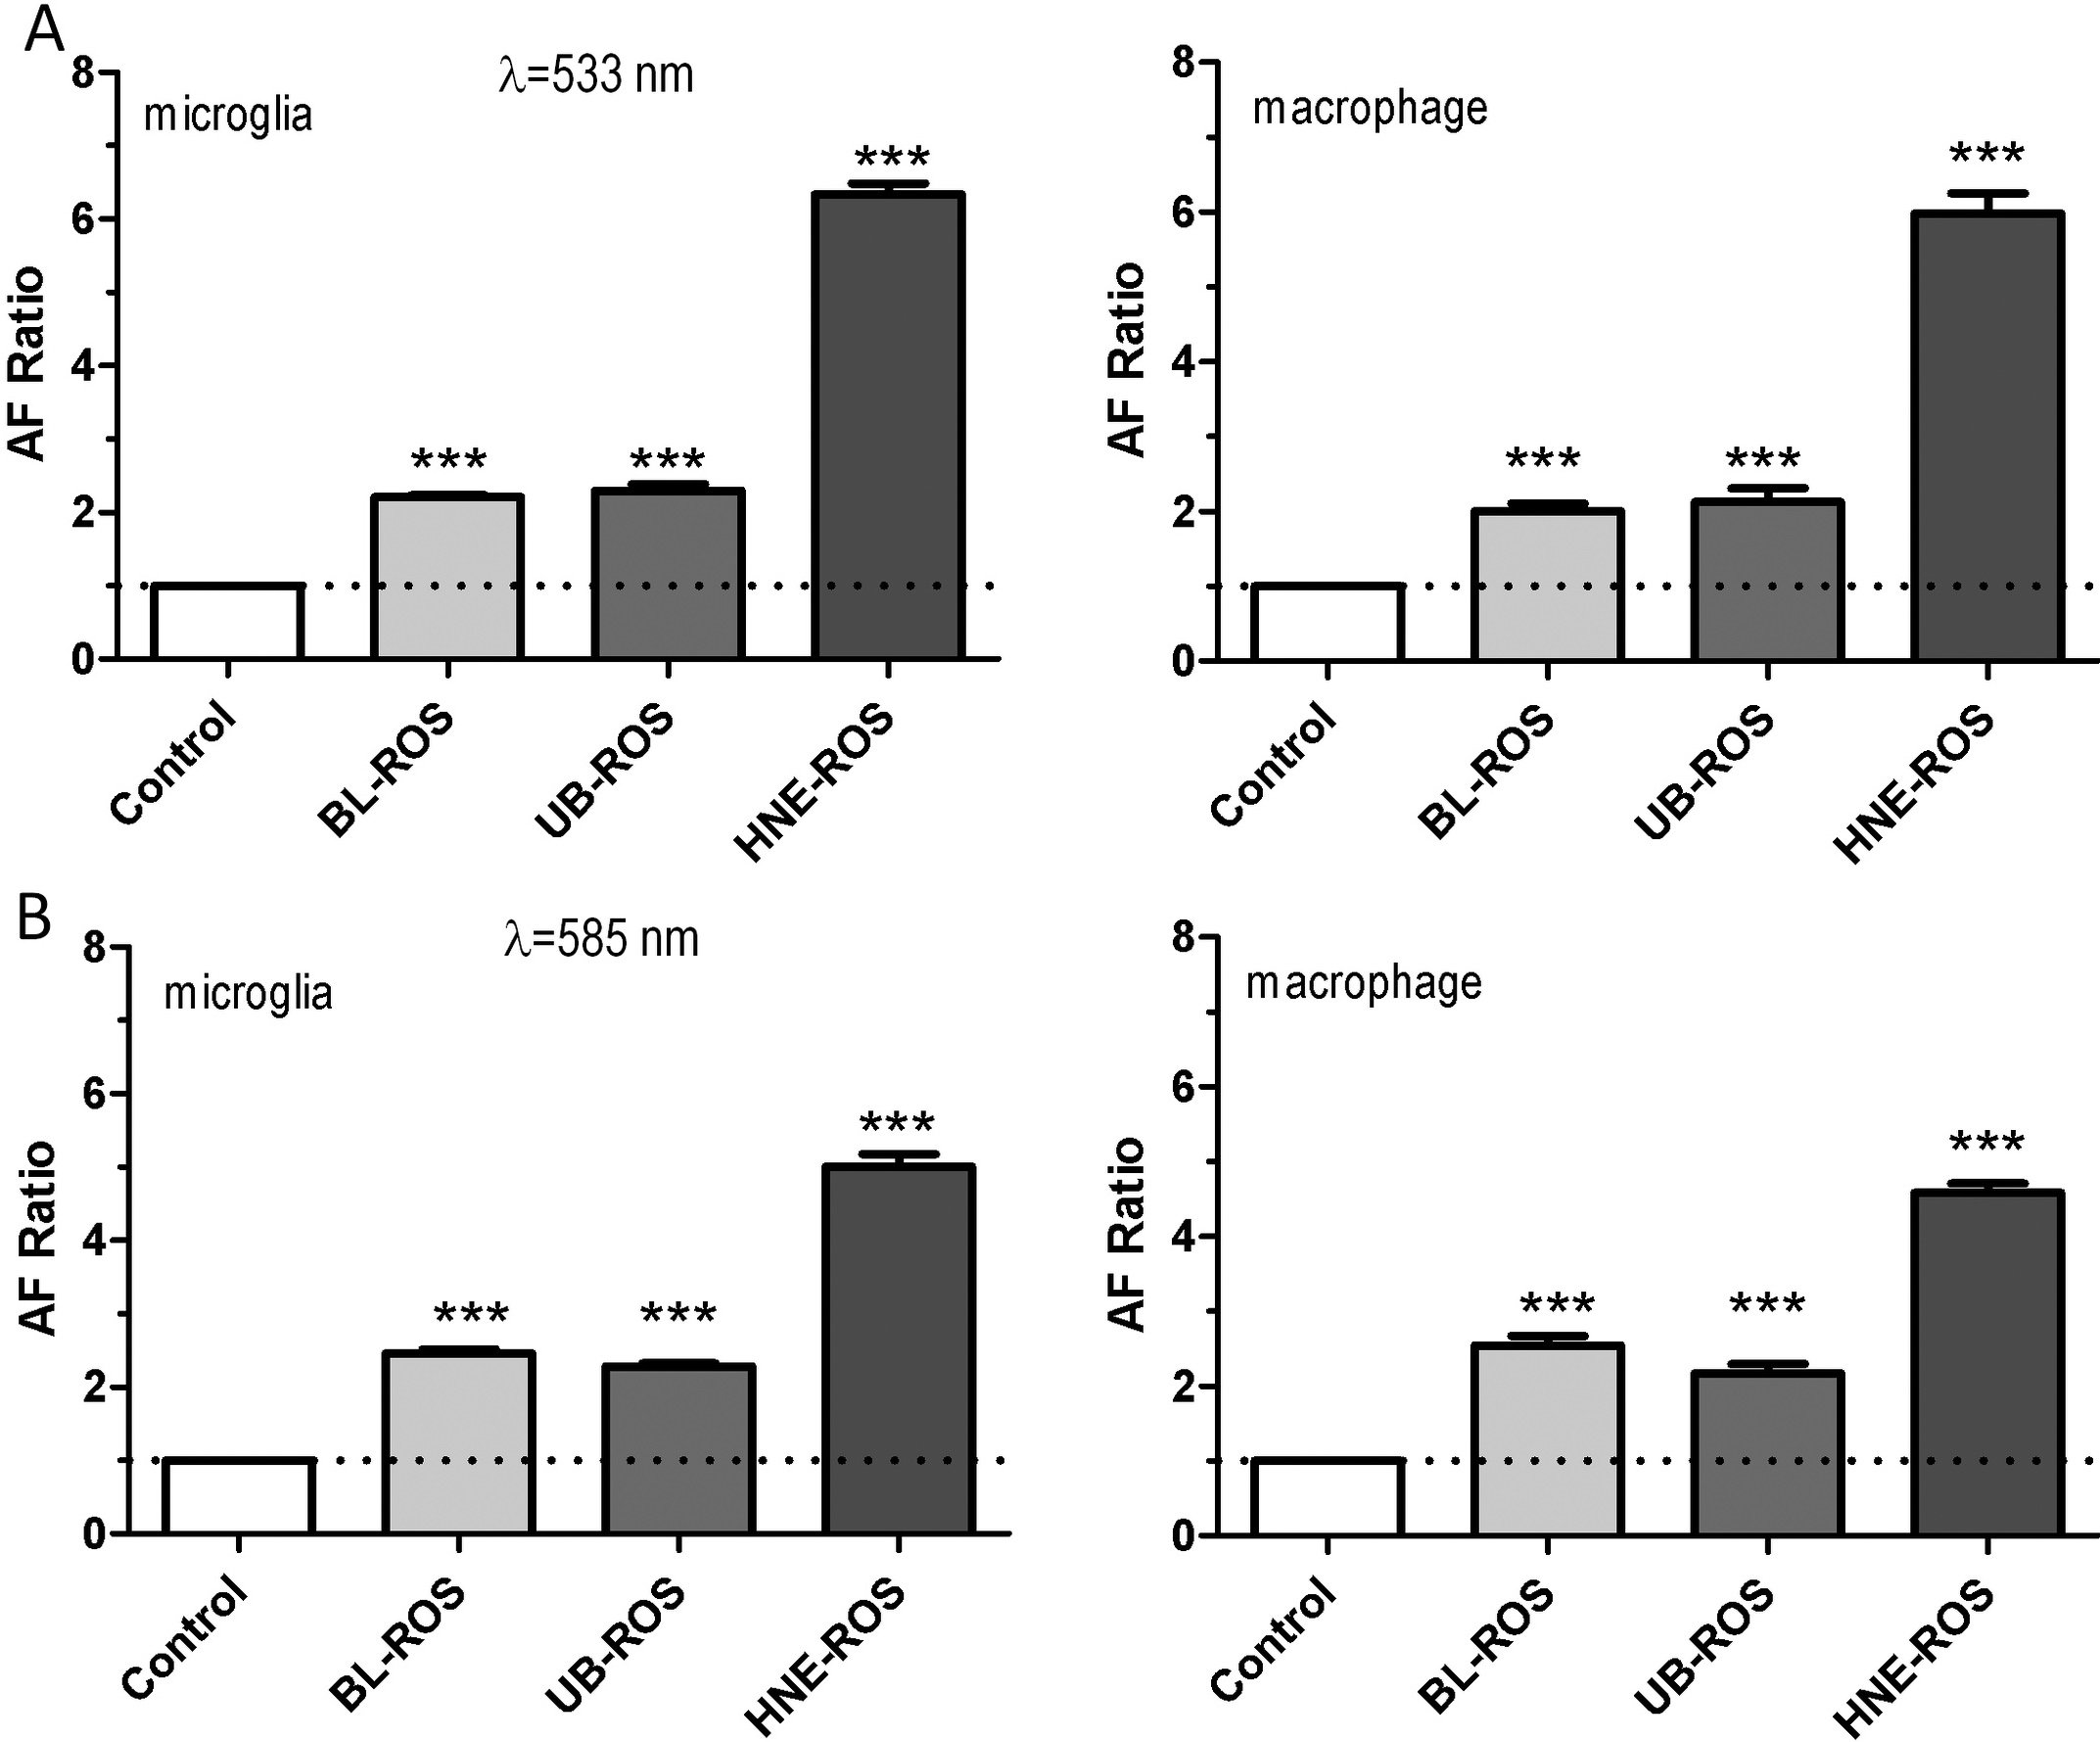
 Figure 2
of Lei, Mol Vis 2012; 18:103-113.
Figure 2
of Lei, Mol Vis 2012; 18:103-113.