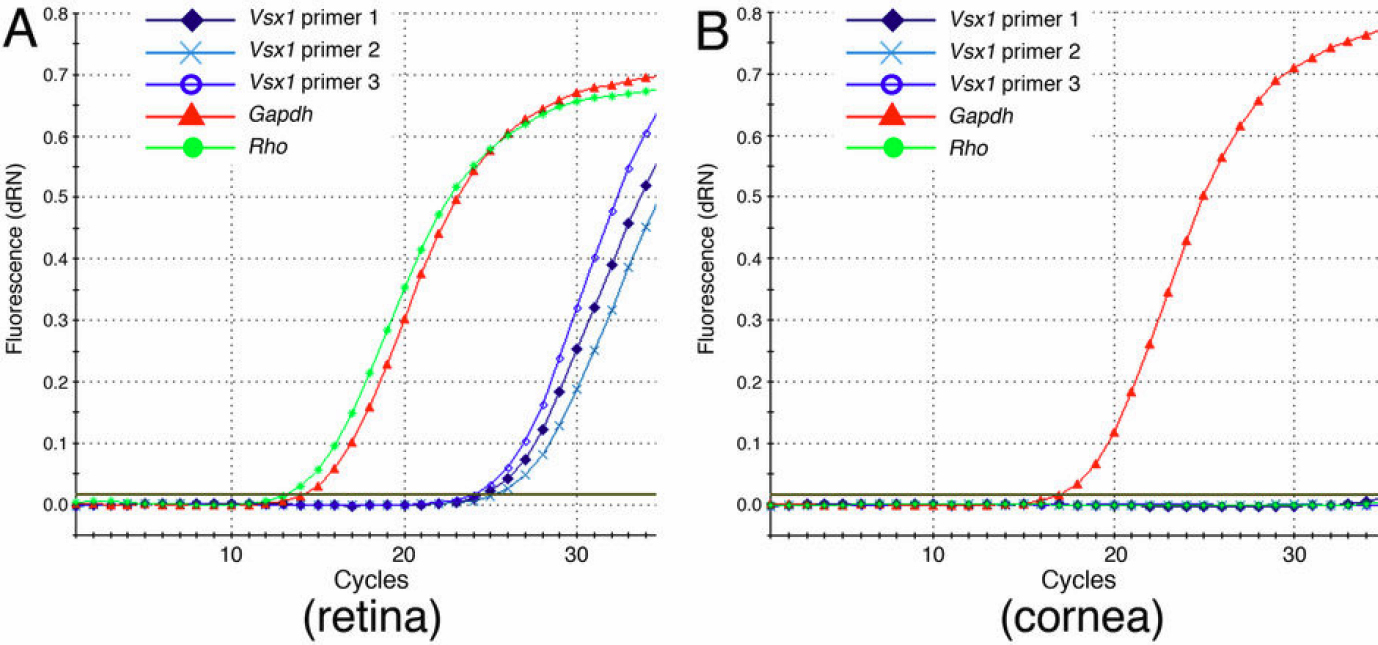
Figure 2. Representative
Vsx1 qRT-PCR amplification plots. Amplification plots of qRT–PCR of wild type mouse retinal (
A) and corneal (
B) samples using primers for
Vsx1,
Gapdh and
Rho shown in
Table 1. x-axis shows qRT–PCR cycle number, y-axis shows SYBR-green fluorescence values.
 Figure 2 of
Watson, Mol Vis 2011; 17:737-744.
Figure 2 of
Watson, Mol Vis 2011; 17:737-744.