Figure 4. Heat map of differentially expressed genes in HTFs after CTGF stimulation. Differentially expressed genes were analyzed and
categorized via “gene ontology.” The selected categories (A) “response to wounding and inflammatory response,” (B) “extracellular matrix,” (C) “anti-apoptosis,” and (D) “cell proliferation” are shown. Color represent measured signal intensity from lowest (green) to highest (red) value.
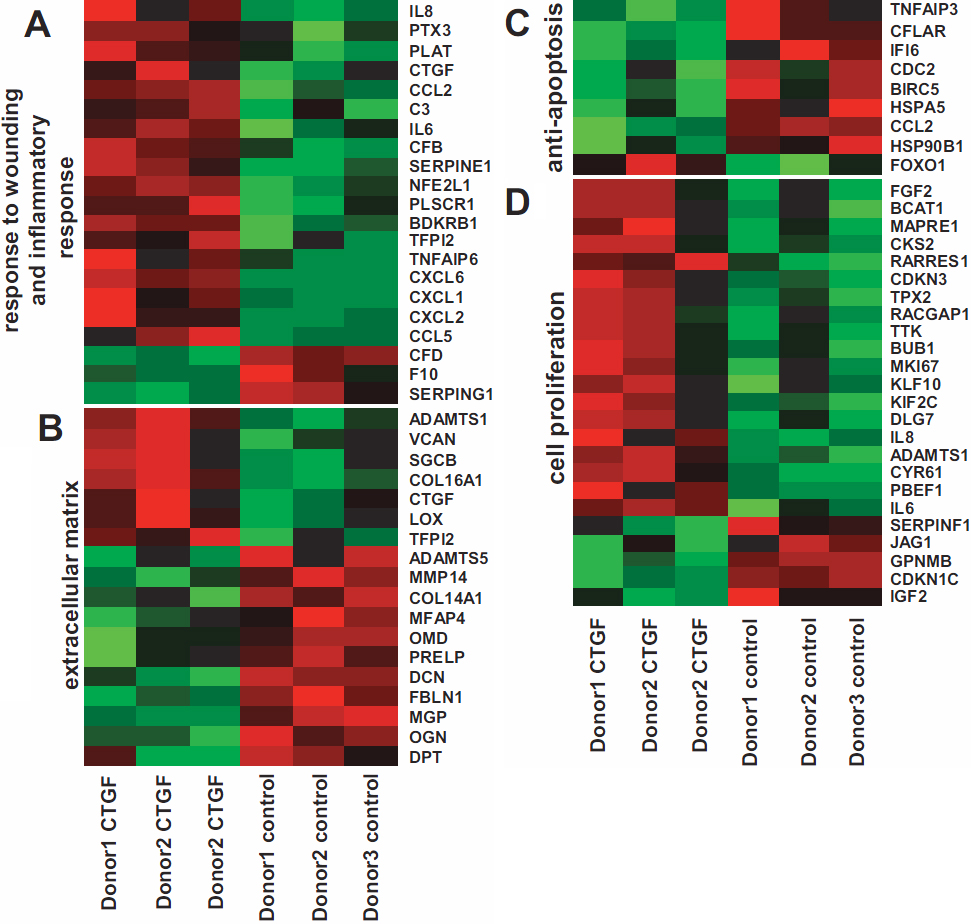
 Figure 4 of
Seher, Mol Vis 2011; 17:53-62.
Figure 4 of
Seher, Mol Vis 2011; 17:53-62.