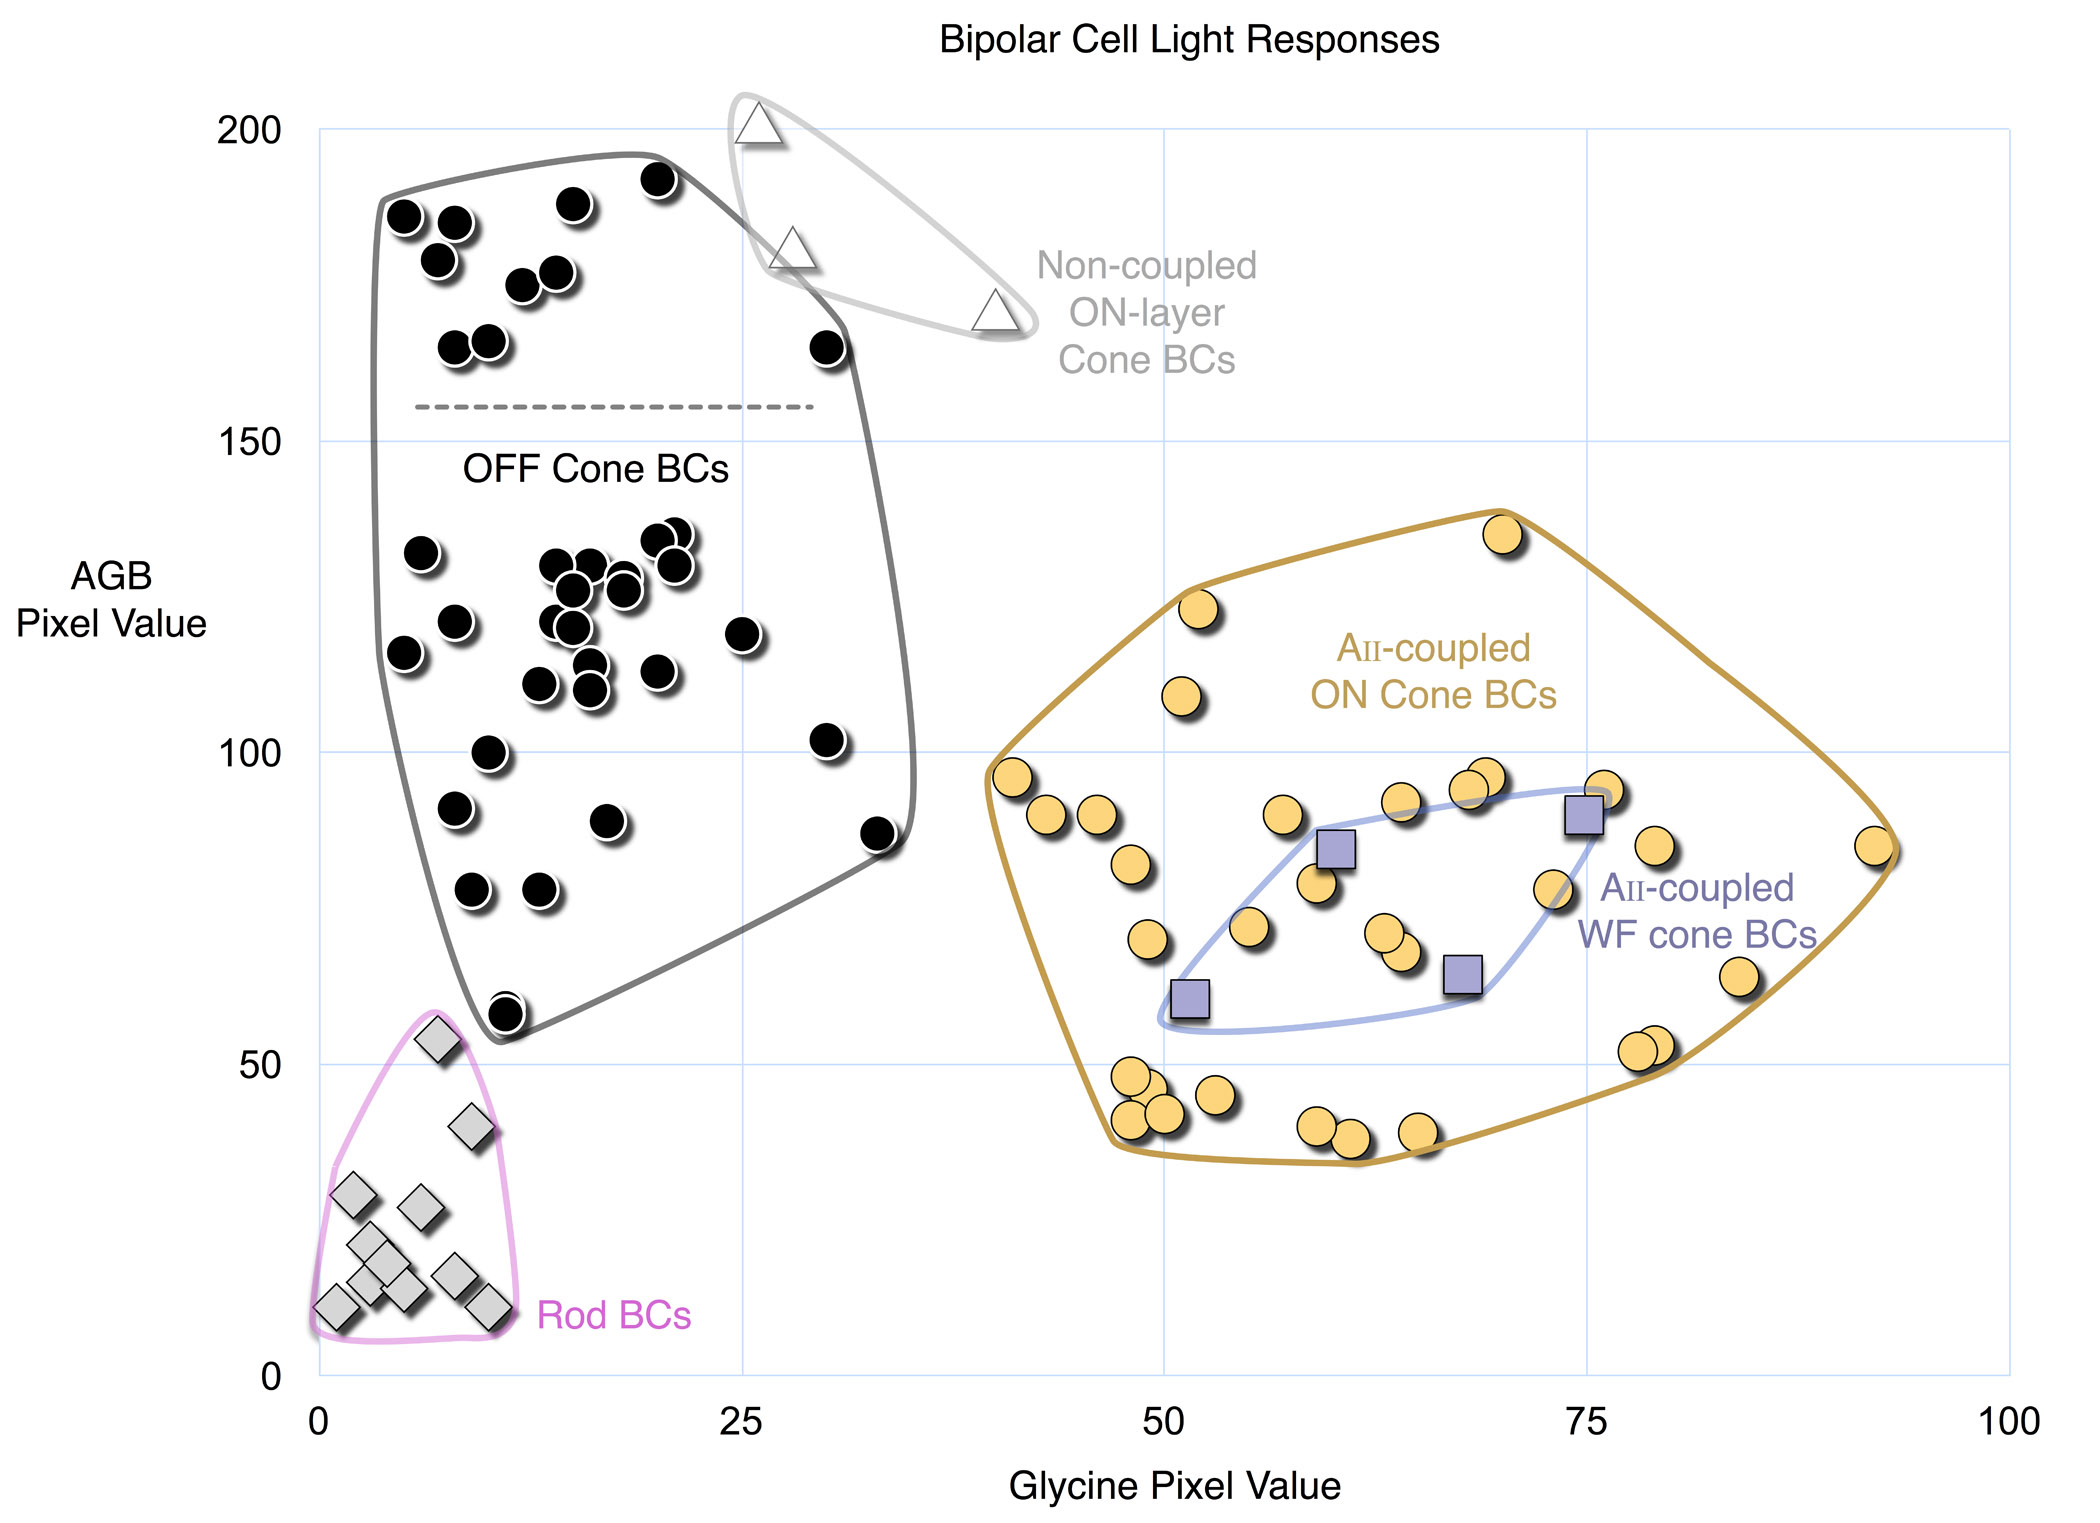
Figure 17. Bivariate glycine (abscissa)
and photopic light-stimulated AGB signals (ordinate) for the validated
bipolar cells shown in
Figure 14 form unique clusters.
OFF cone bipolar cells (black) have some of the strongest light-driven
responses, while the mean response of most coupled ON cone bipolar
cells (orange) is weaker. WF bipolar cells form a small subgroup within
the entire G+ ON bipolar cell cluster (blue). Rod bipolar cells show no
significant response. Conversely, three non-coupled, G- cone BCs
terminating high in the ON layer have extremely strong responses
(white). The stimulus regime was a 3 Hz pulse train of 3 yellow/black
pulse cycles followed by one blue/black pulse cycle with a 50% duty
cycle over 90 min.
 Figure 17 of Anderson, Mol Vis 2011; 17:355-379.