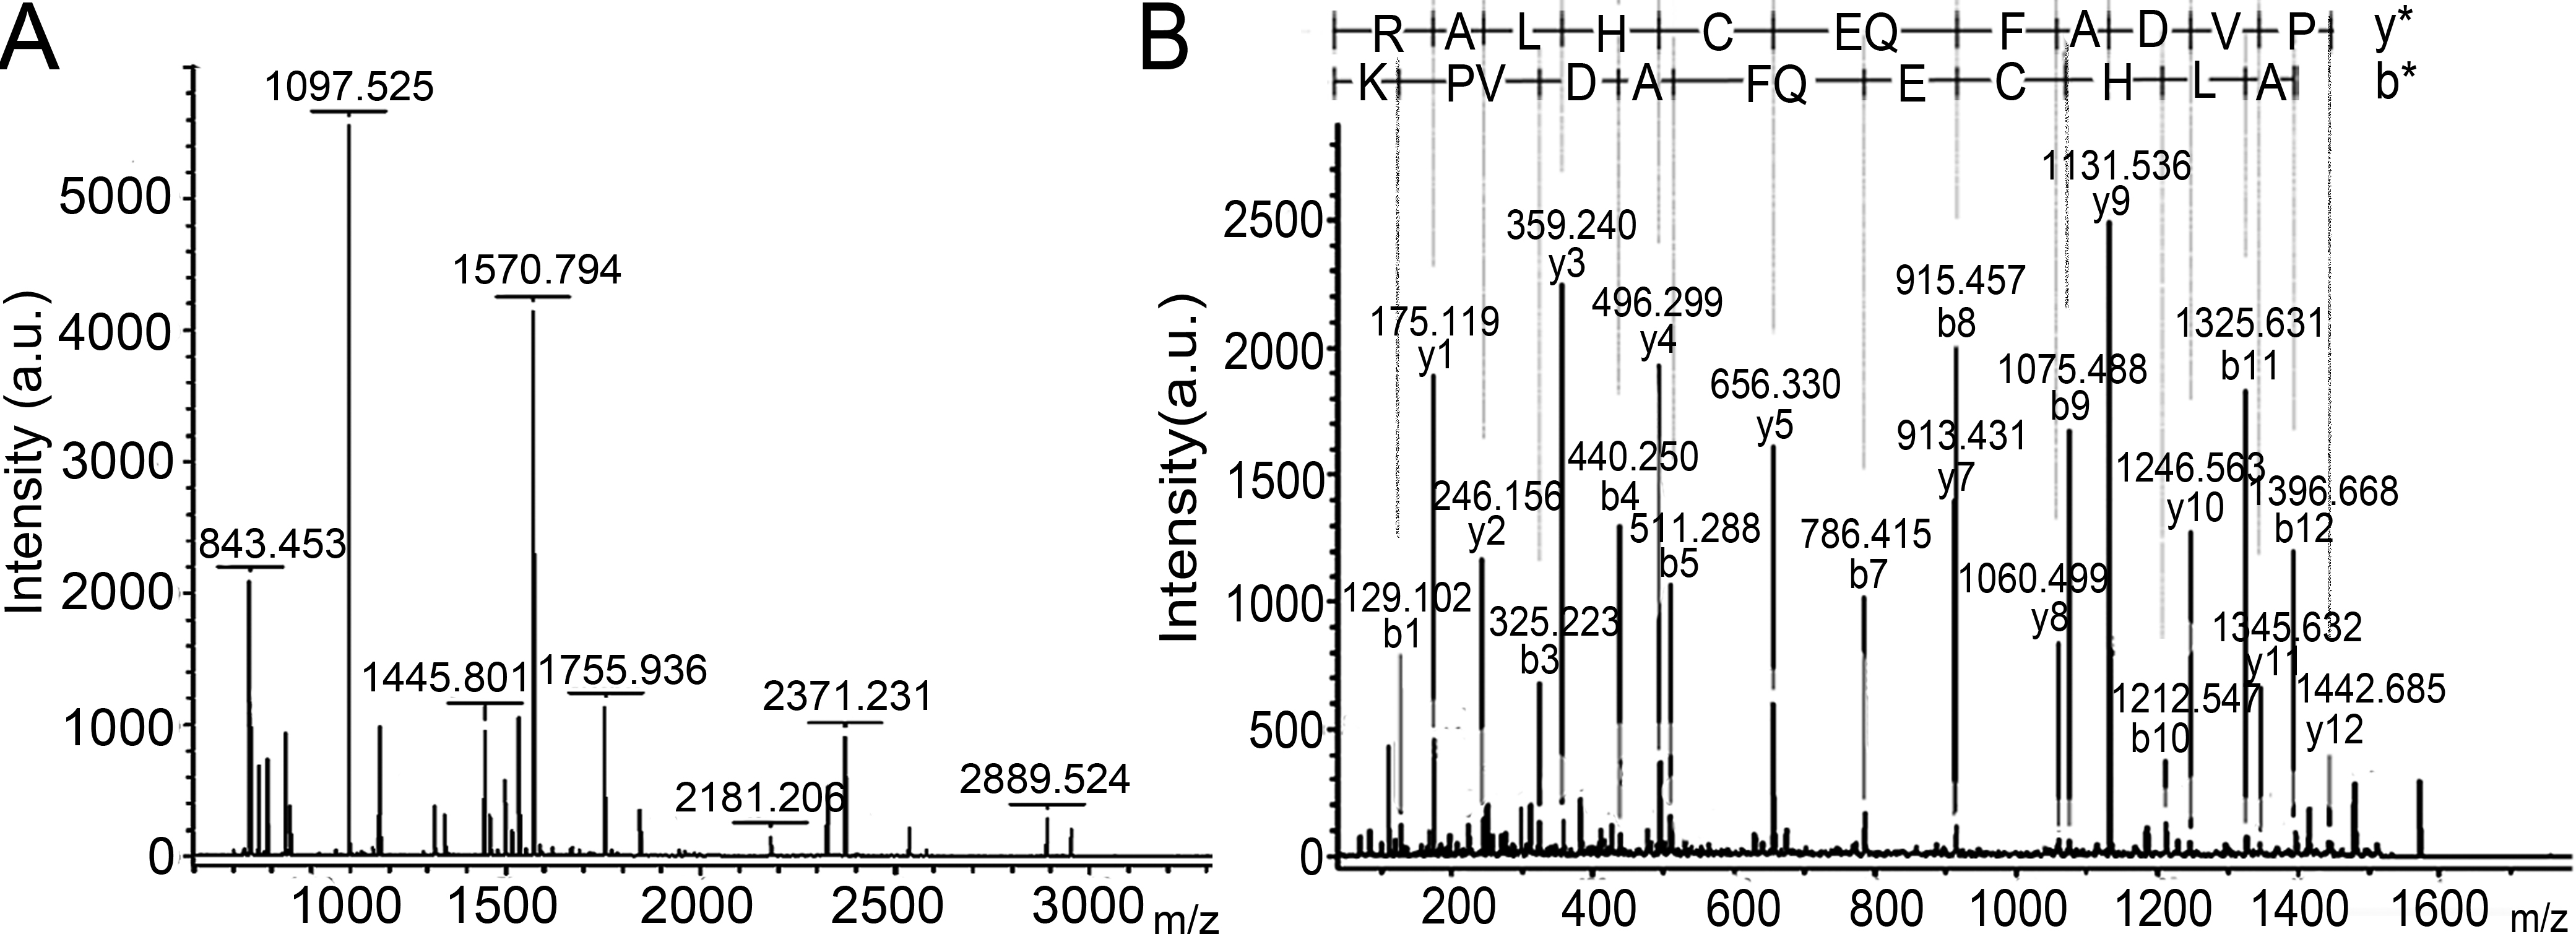
Figure 3. The MALDI-TOF/TOF mass spectrum
analysis of spot w6 in
Figure 2 indentified as LF (
Camelus
dromedarius, gi|5777368).
A: The PMF signals.
B:
The MS/MS spectrum of parent ion 1570.794 for the sequence
KPVDAFQECHLAR calculated by b ions (b*) and y ions (y*).
 Figure 3 of Chen, Mol Vis 2011; 17:323-331.