Figure 2. Comparison of 2-DE
Coomassie-stained protein profiles and differential expression spots of
camel tears between summer and winter. A: Tear proteins (100
μg) in the summer (Cs) and in the winter (Cw) were separated on
first-dimensional pH 3–10 linear IPG gels (13 cm) and
second-dimensional 13% vertical slab gels. The relative MW is given on
the left, while the pI is given at the top of the figure. The spots
marked by arrows and numbers were cut and digested, and then identified
using MALDI-TOF/TOF-MS. B-I: Protein spots w1, w2, w3 and s7, and w7
with different volume intensities are displayed in the enlarged spot
views of 2-DE images (B-E) and as three-dimensional
images obtained by Melanie 4.0 software (F-I). Spots w1,
w2, w3, w4, w5, w6 and s4, s5, and s6 were identified as LF and spots
s7 and w7 were characterized as VMO1 homolog. B, D, F,
H: The summer group (Cs); C, E, G, I:
The
winter group (Cw).
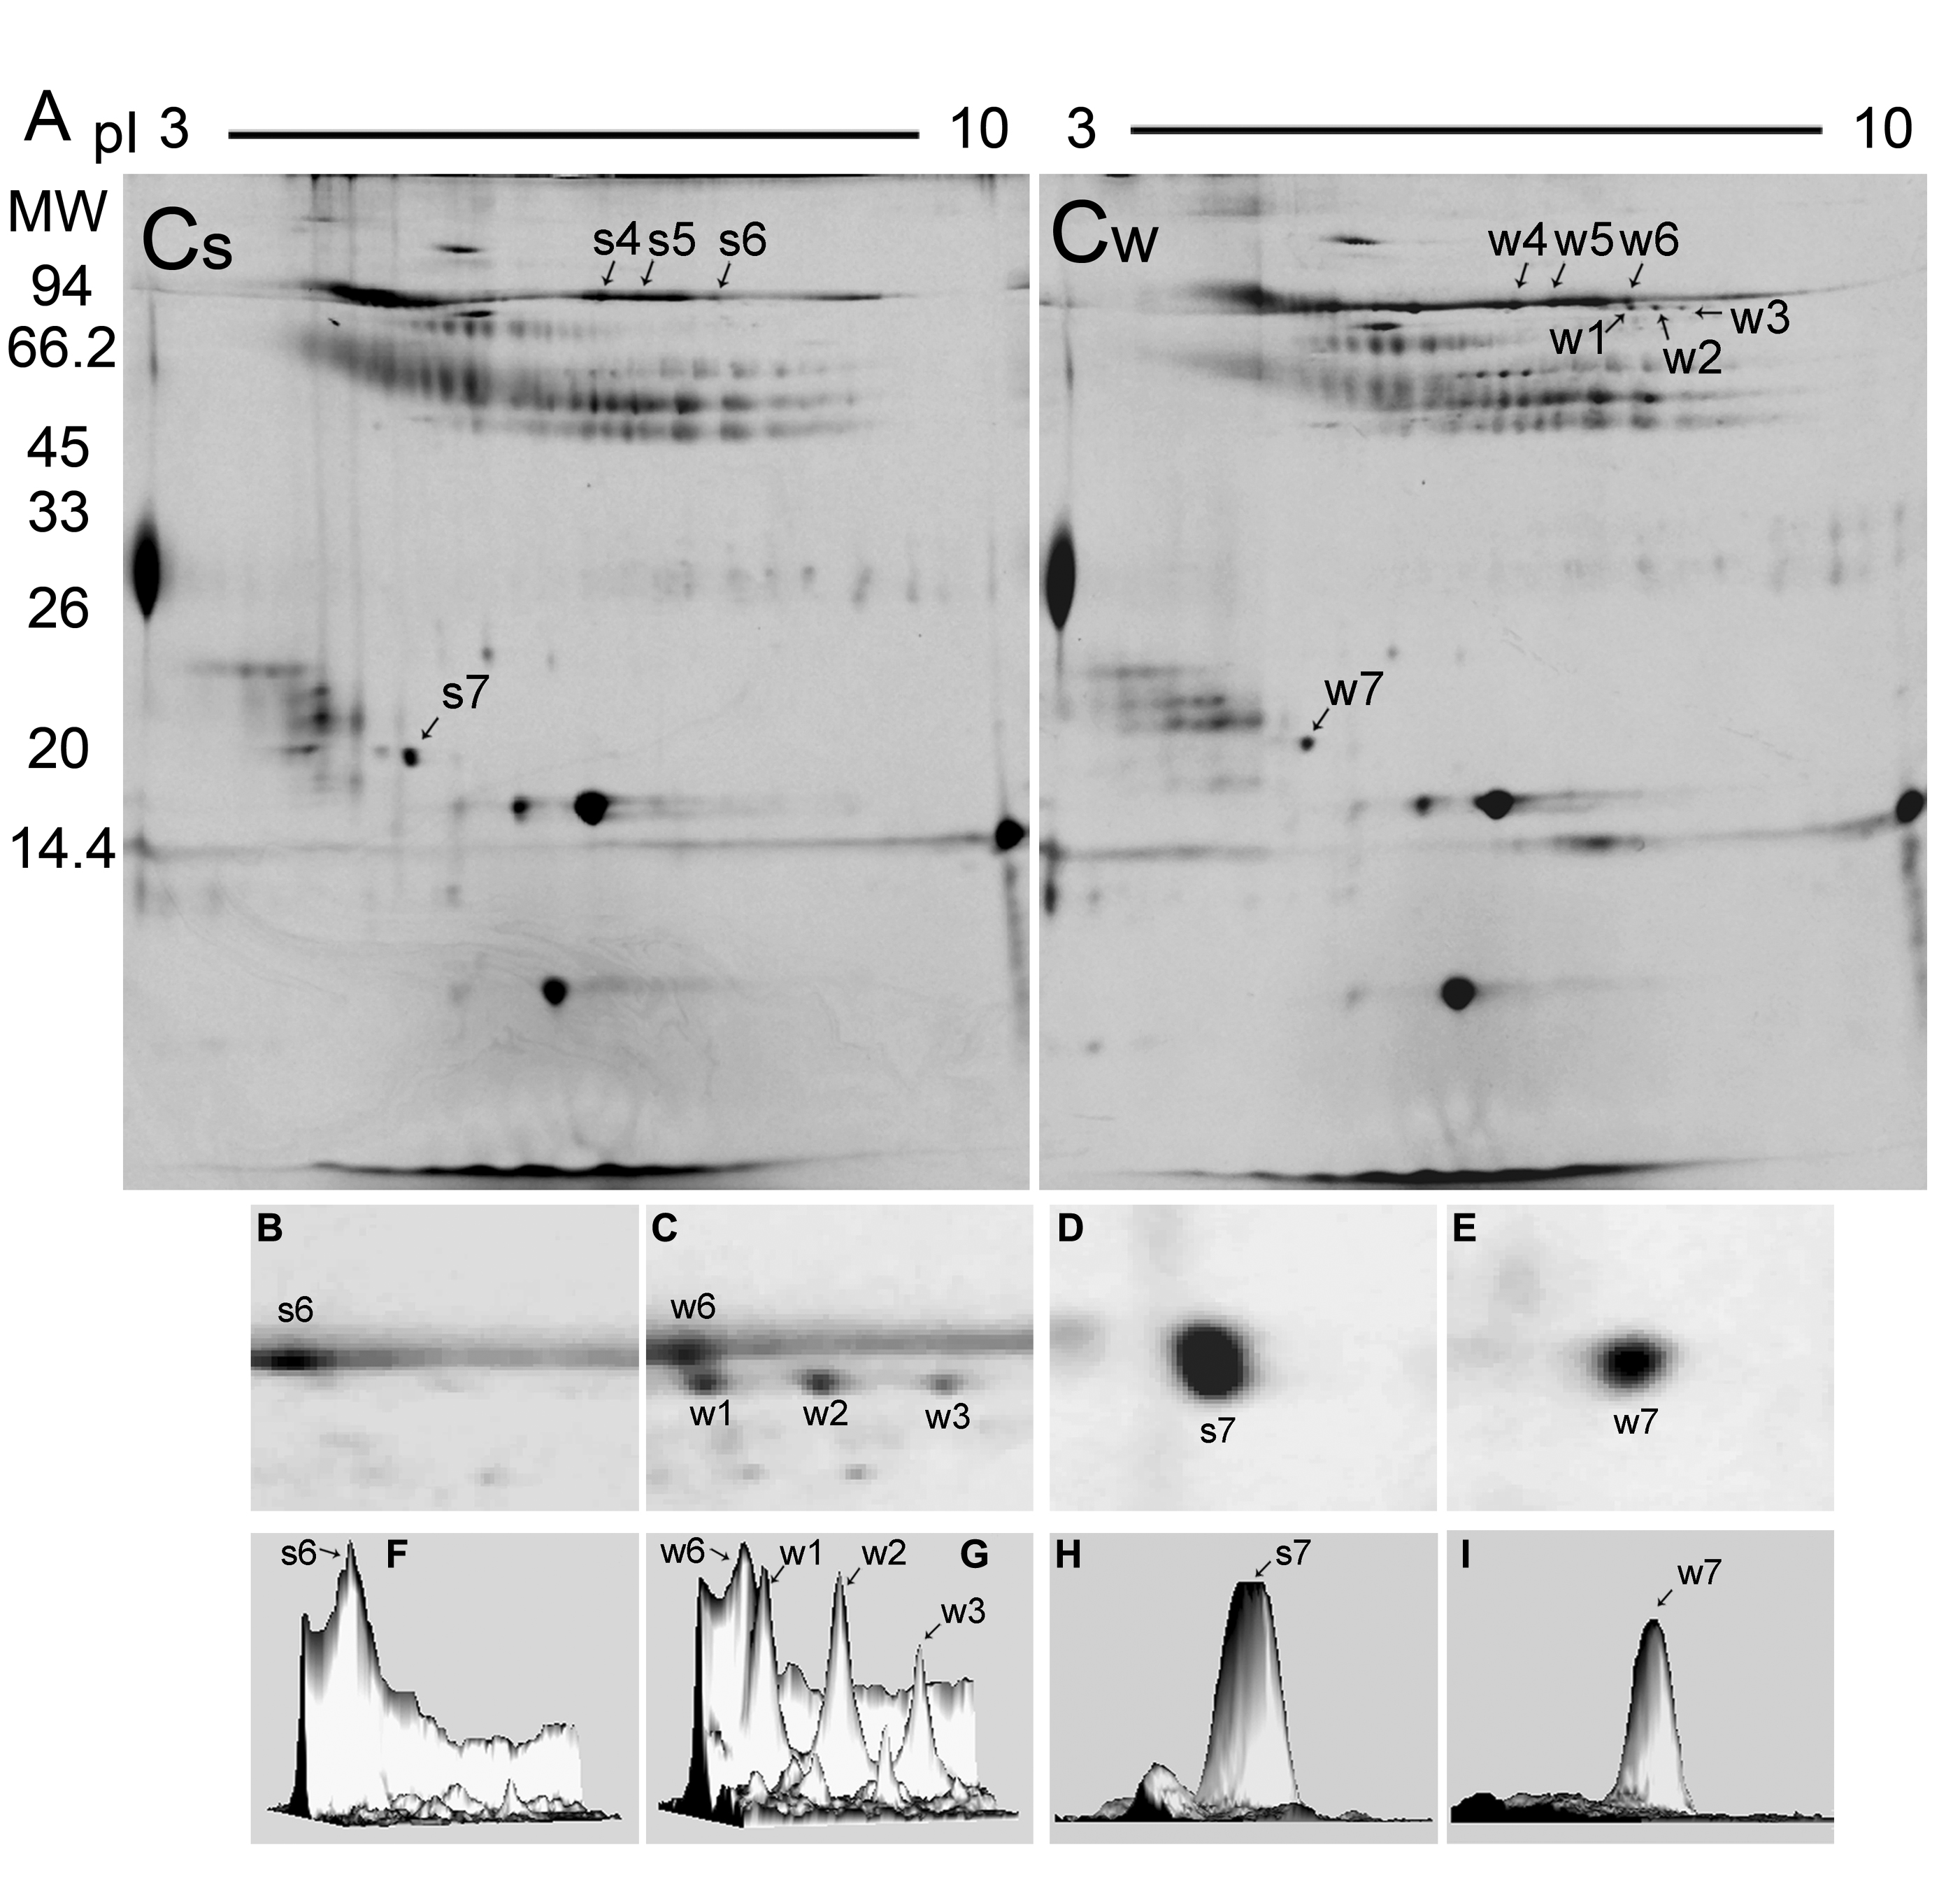
 Figure 2 of Chen, Mol Vis 2011; 17:323-331.