Figure 3. IL-6 levels measured by
ELISA. The IL-6 levels decreased with an increase in the CYS
concentration (p=0.003; Kruskal–Wallis test). PHA-stimulated
PBMCs served as the positive control and unstimulated PBMCs
served as the negative control. *: statistically significant by
the Mann–Whitney U test.
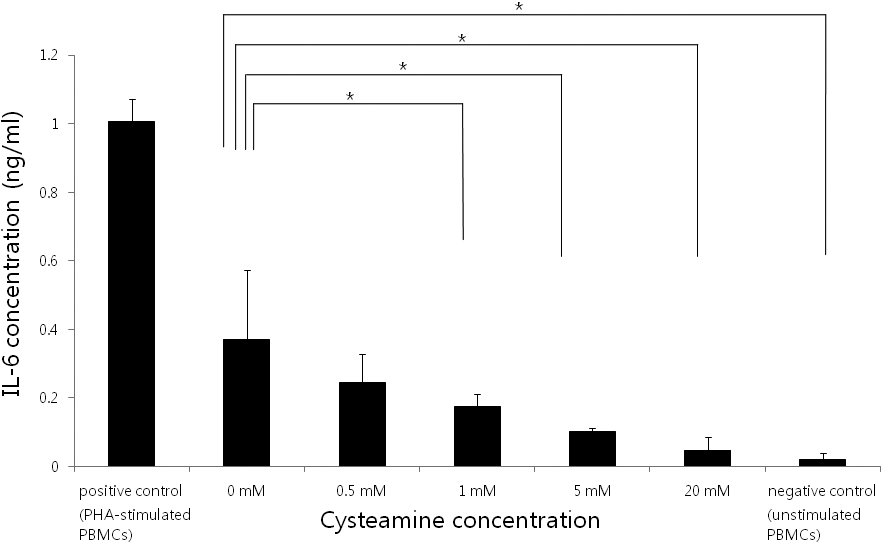
 Figure 3
of Shin, Mol Vis 2011; 17:3371-3378.
Figure 3
of Shin, Mol Vis 2011; 17:3371-3378.