Figure 2. Relative 2′′dichlorofluorescein (DCF) fluorescence. CYS decreased intracellular ROS levels in a dose-dependent manner (p<0.001;
Kruskal–Wallis test). PHA-stimulated PBMCs served as the positive control and unstimulated PBMCs served as the negative control.
*: statistically significant by the Mann–Whitney U test.
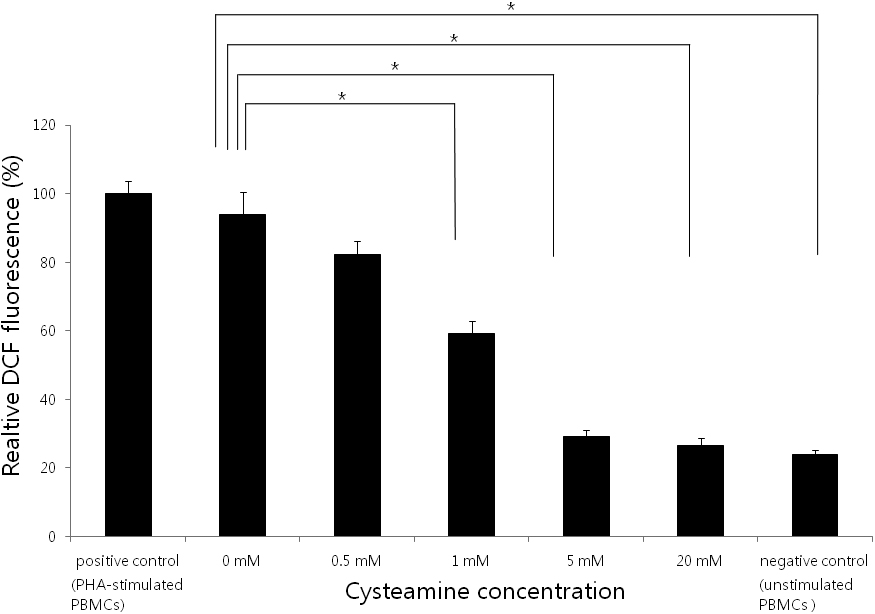
 Figure 2 of
Shin, Mol Vis 2011; 17:3371-3378.
Figure 2 of
Shin, Mol Vis 2011; 17:3371-3378.