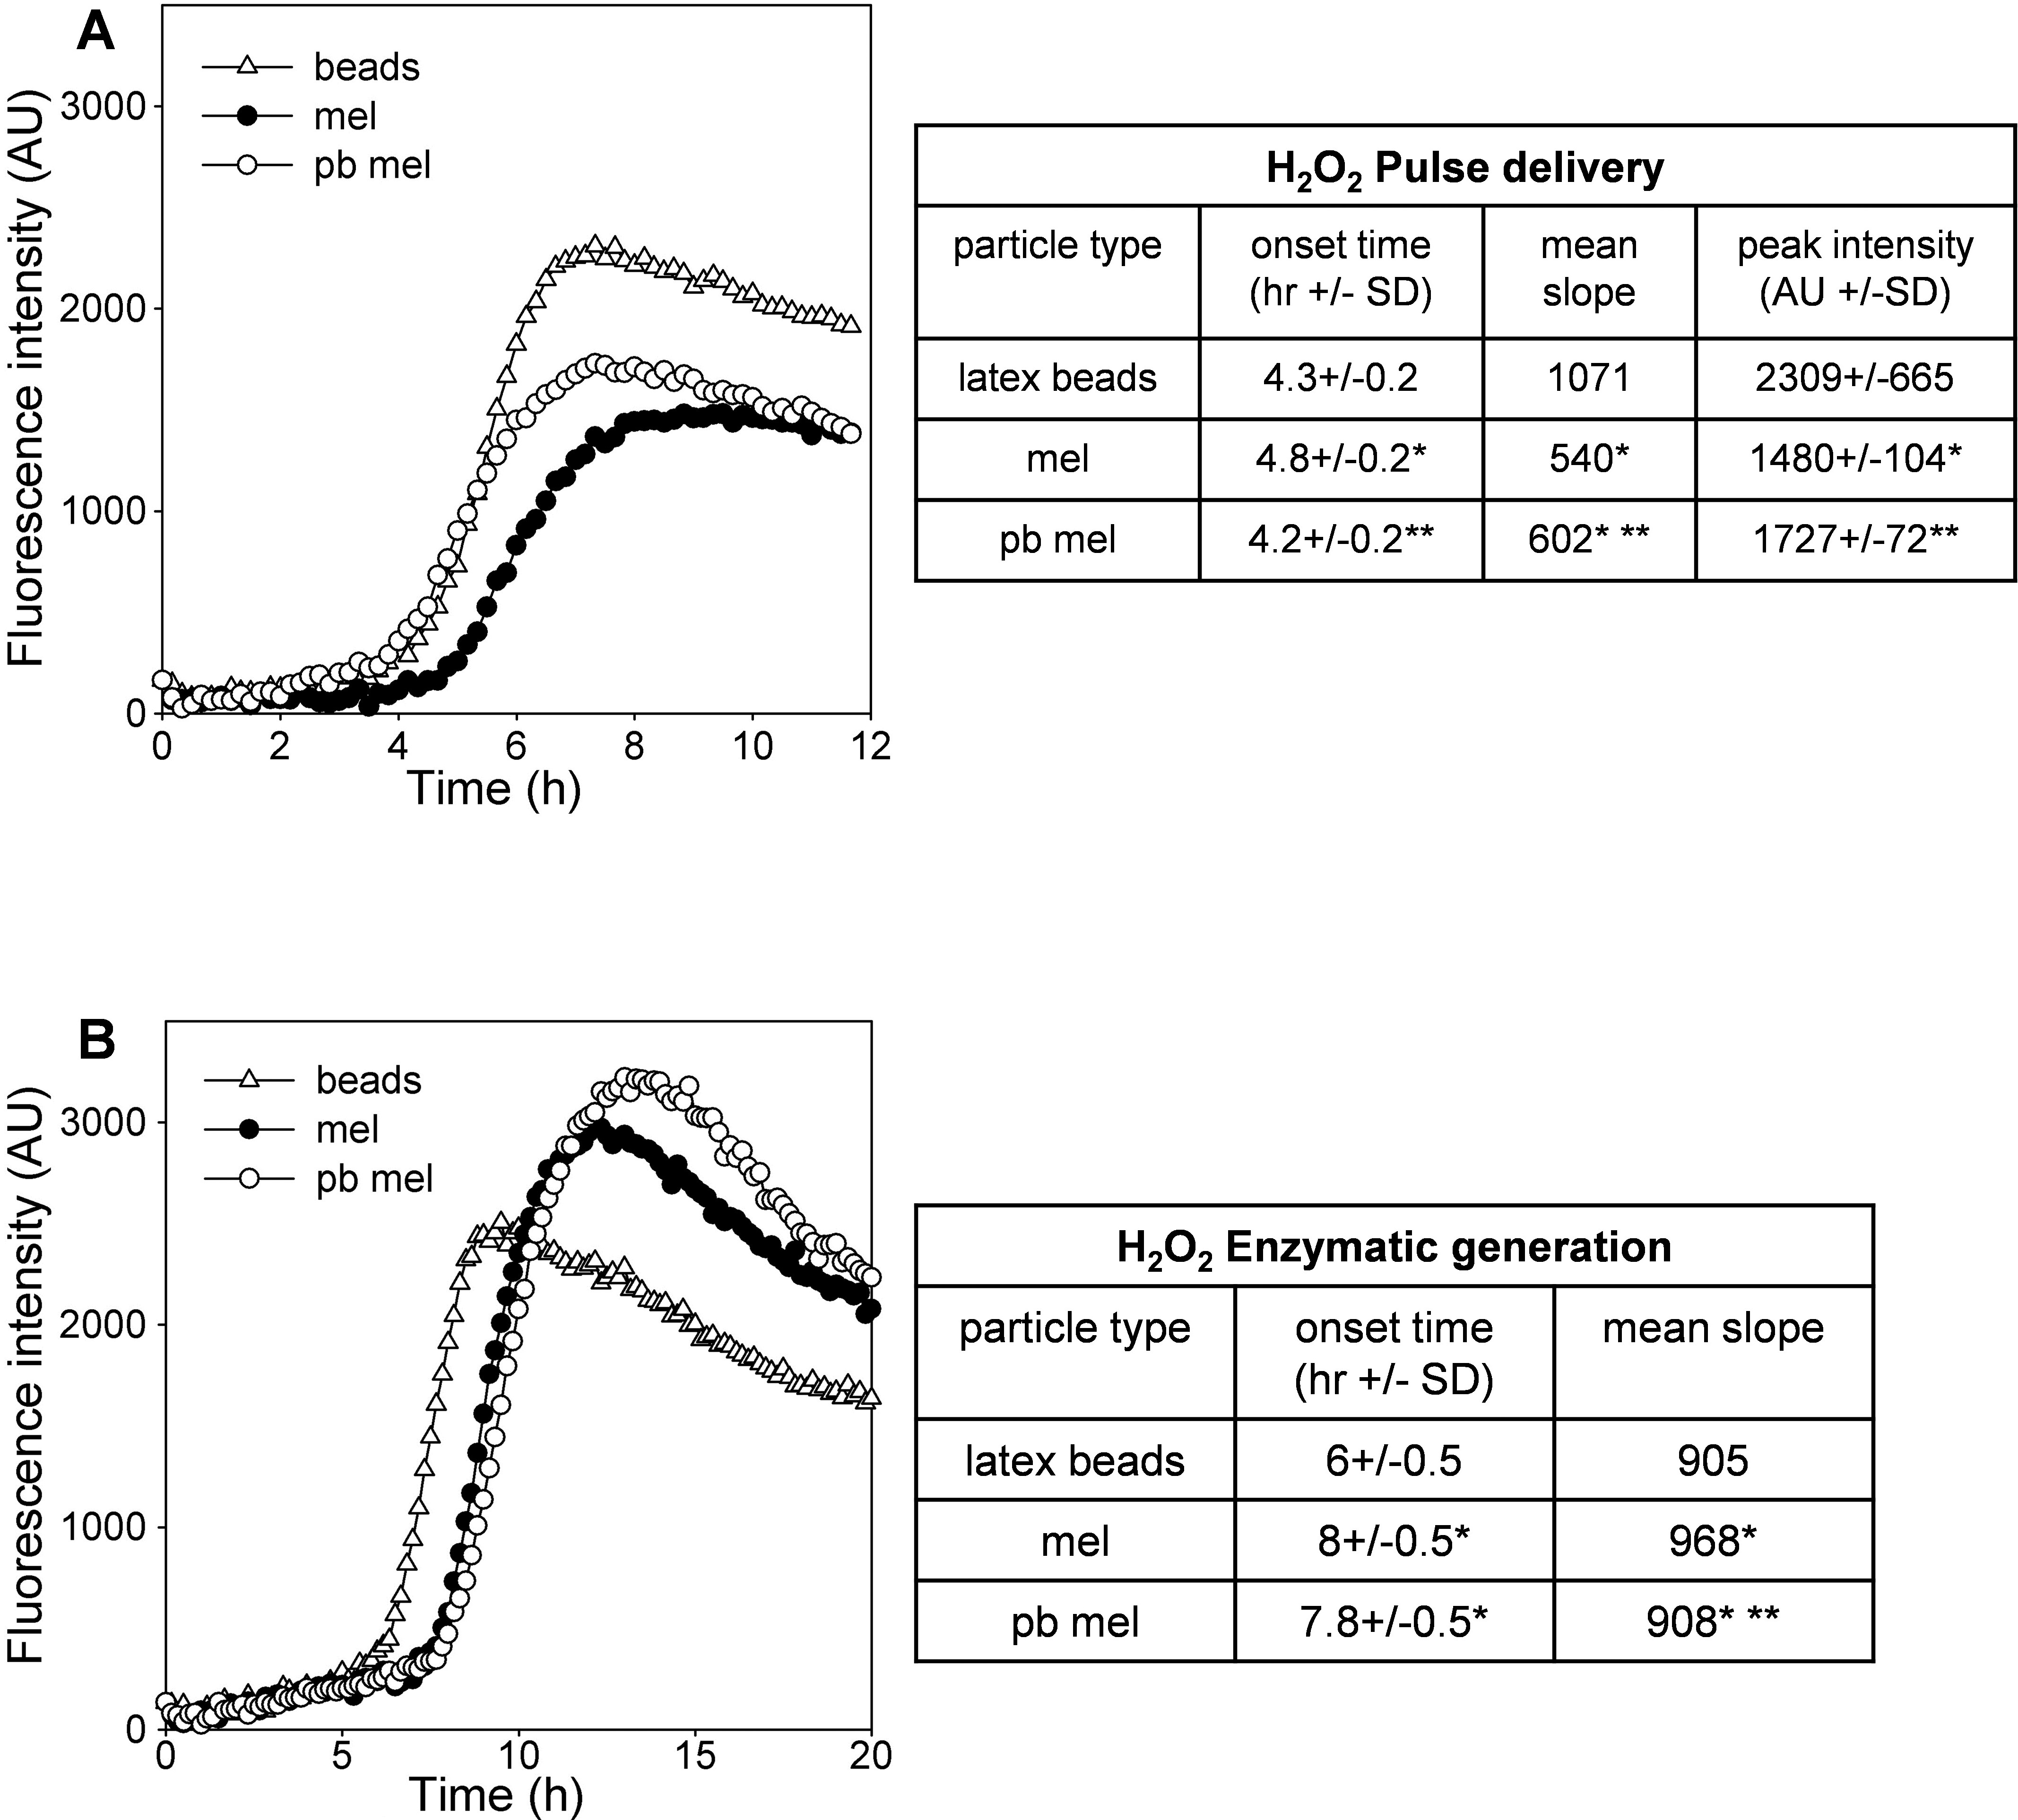
Figure 3. Effect of phagocytosed
melanosomes on the sensitivity of ARPE-19 cell populations to H
2O
2-induced
toxicity. Dynamic changes in propidium iodide (PI) fluorescence
(in arbitrary units [AU]) in ARPE-19 cultures treated with
A:
200 μM H
2O
2 or
B: 16 mU/ml glucose
oxidase (GOx) to generate H
2O
2
enzymatically. Cells were pre-loaded by phagocytosis with latex
beads (triangles), untreated melanosomes (mel, black circles) or
photobleached melanosomes (pb mel, open circles). Data are the
means of 3 replicate culture wells per treatment group within
representative experiments of each type. Accompanying tables
show the corresponding quantitative data. Onset times, mean
slopes and peak intensities are as described in
Figure 1B
and
Table
1. Single asterisks indicate where the outcome
for that parameter differs significantly from the latex bead
control; double asterisks indicate where pb mel differs
significantly from mel (unpaired
t tests with equal
variances, p<0.02).
 Figure 3
of Burke, Mol Vis 2011; 17:2864-2877.
Figure 3
of Burke, Mol Vis 2011; 17:2864-2877.