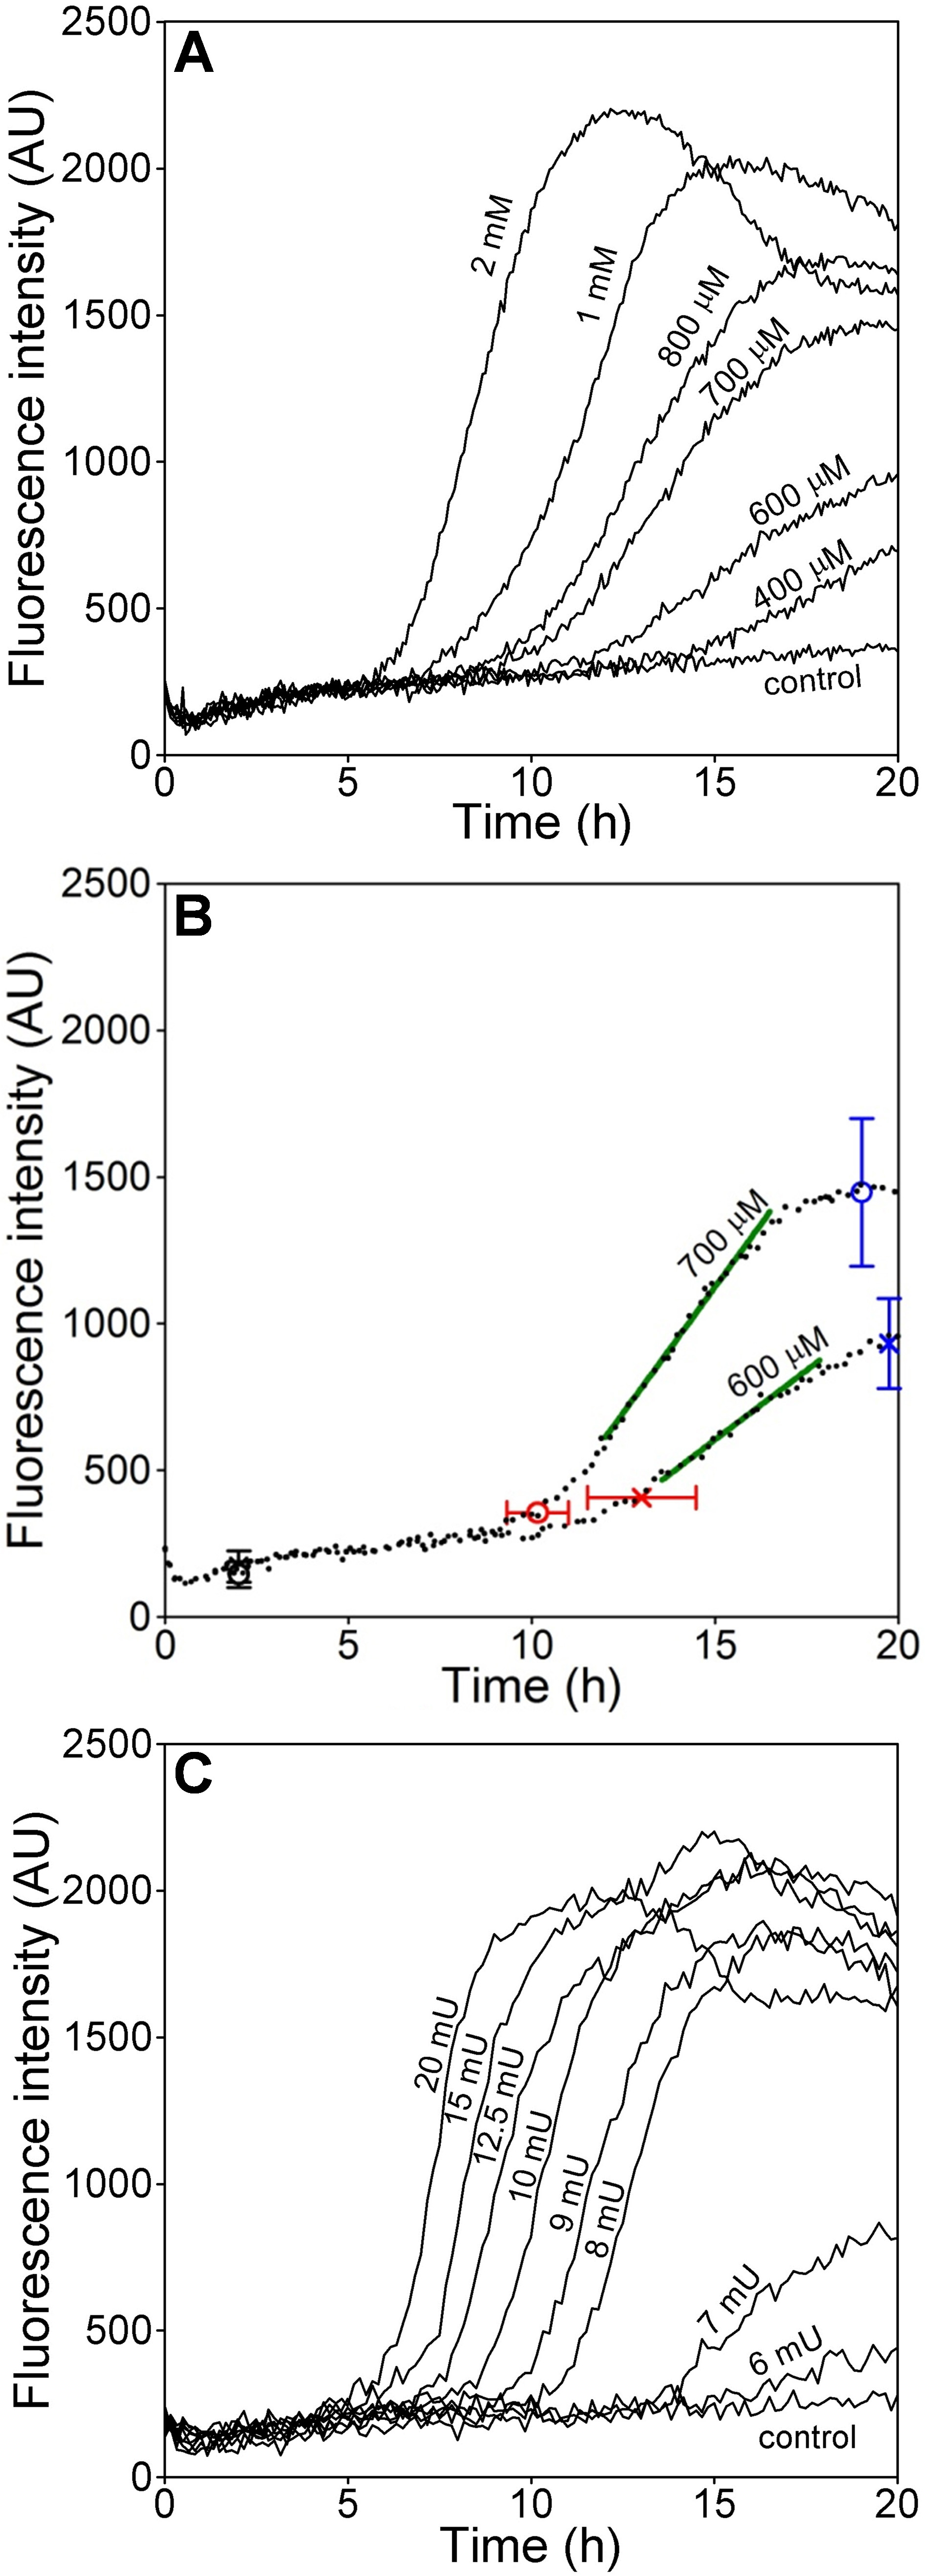
Figure 1. Dose-dependent H
2O
2-induced
toxicity in ARPE-19 cell populations shown by dynamic changes in
propidium iodide (PI) fluorescence. PI fluorescence (in
arbitrary units) was measured over 20 h in replicate wells of
ARPE-19 cultures exposed to varying amounts of H
2O
2.
A: H
2O
2 delivered as pulse at the
concentrations indicated.
B: Isolates three components
of the curves for PI fluorescence intensity that were used for
comparison between treatment groups, using 600 (X's) and 700 μM
(circles) H
2O
2 for illustration. The times
of onset of the fluorescence rise (red) relative to baseline at
2 h (black), the mean slopes (green), and the peak fluorescence
values (blue) were determined as described in
Table 1.
C:
H
2O
2 generated enzymatically by the
addition of glucose oxidase (GOx) at the mU/ml concentrations
indicated. Data in
A and
C are the means of 3–6
replicate culture wells per group within representative
experiments.
 Figure 1
of Burke, Mol Vis 2011; 17:2864-2877.
Figure 1
of Burke, Mol Vis 2011; 17:2864-2877.