Figure 5. Quantification of specific
retinal cells per 100 μm length according to their specific markers.
The markers were used to detect at day 90 following the intravitreal
injections. A: Rhodopsin positive cells per 100 μm length in
outer nuclear layer (ONL). B: Calbindin positive cells per 100
μm length in the retina. C: Chx-10 positive cells per 100 μm
length in inner nuclear layer (INL). D: Islet-1 positive cells
per 100 μm length in INL. E: Pax-6 positive cells per 100 μm
length in INL. F: Glial fibrillary acidic protein (GFAP)
positive cells per 100 μm length in the retina. The sample size for all
markers was 5 in all groups. The error bars indicate standard error of
the means (SEMs).
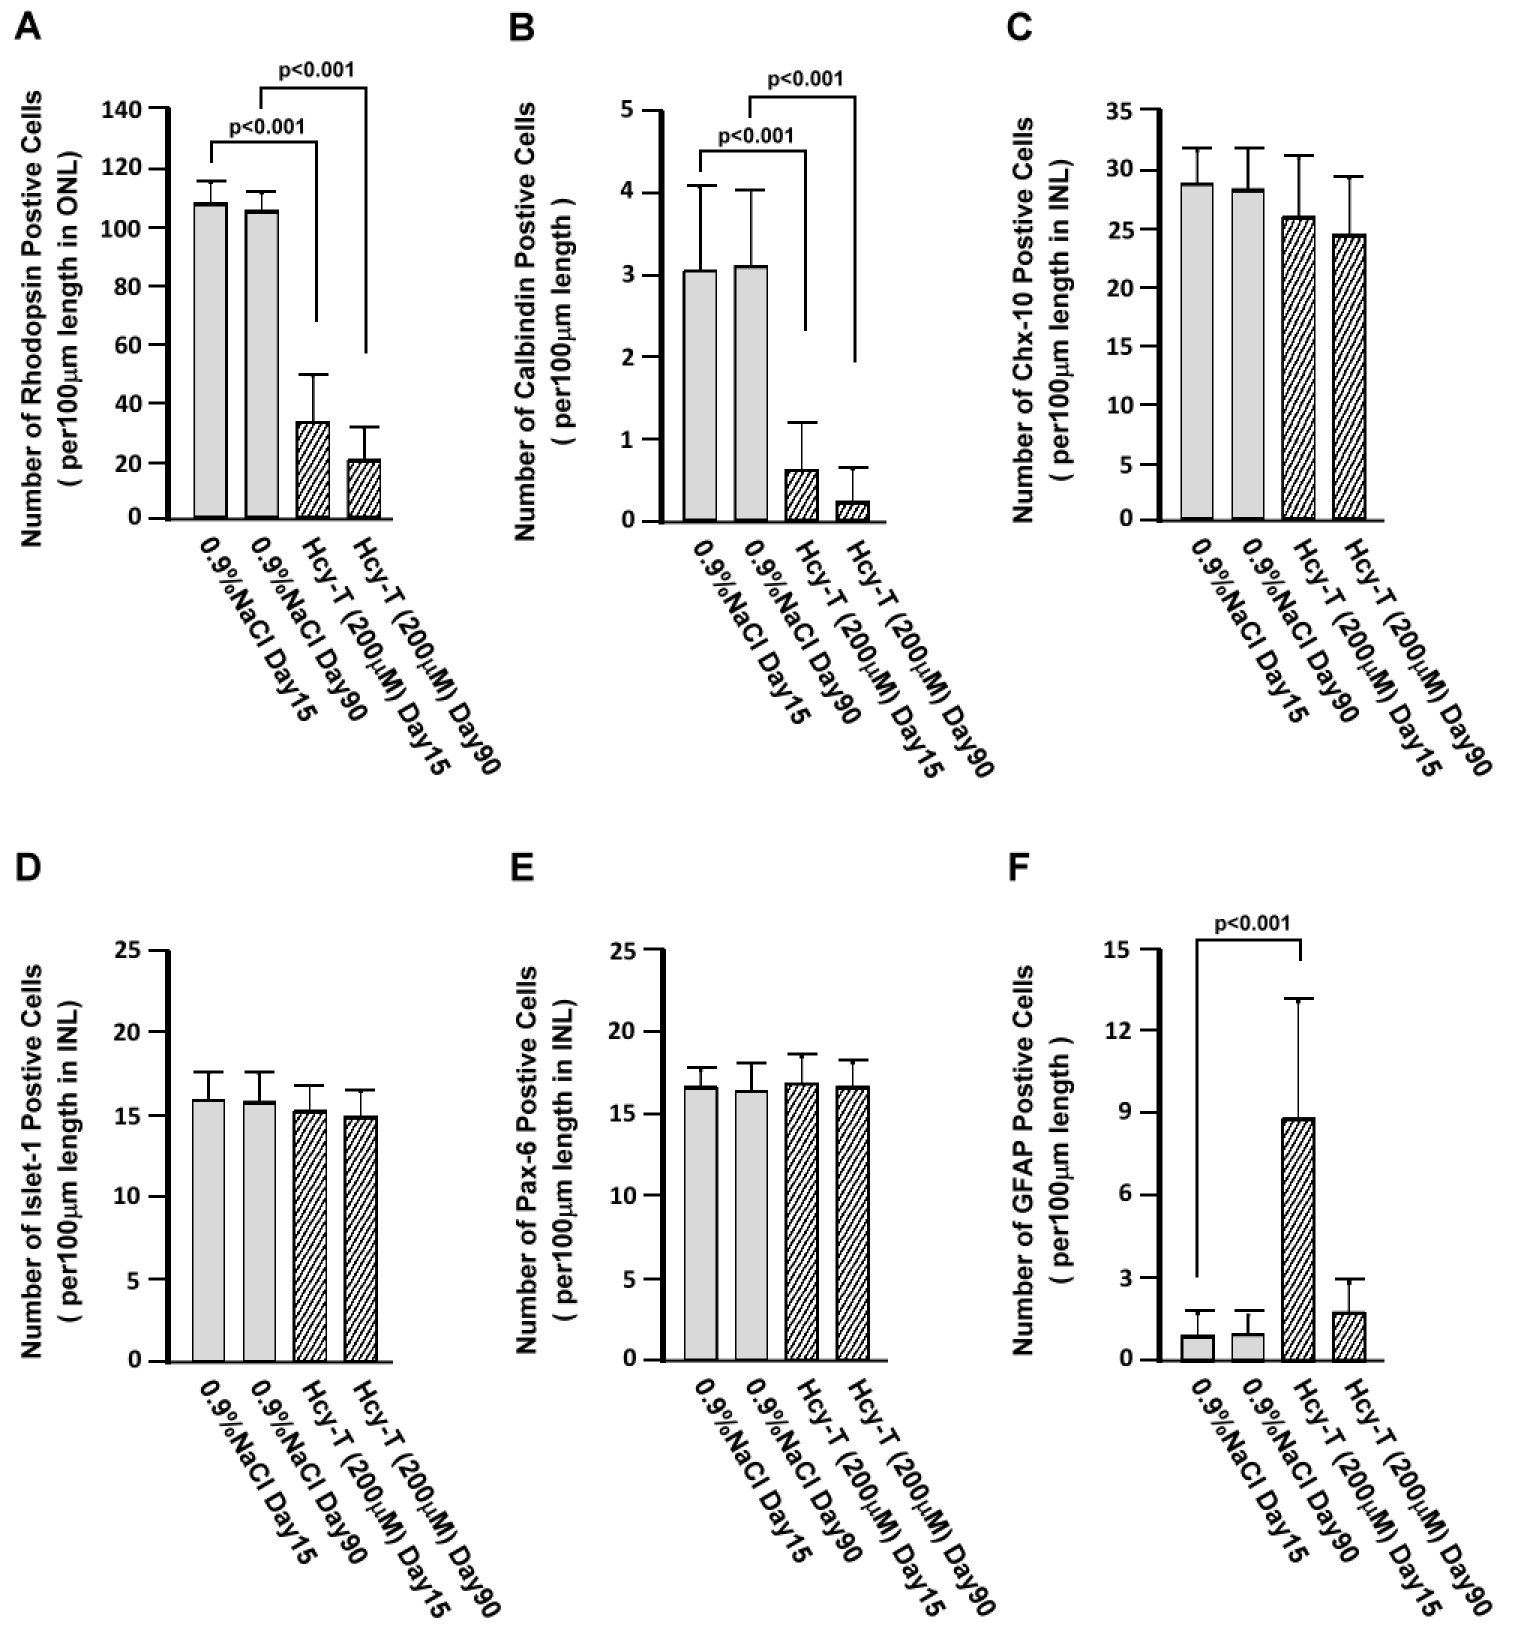
 Figure 5 of Chang, Mol Vis 2011; 17:1946-1956.