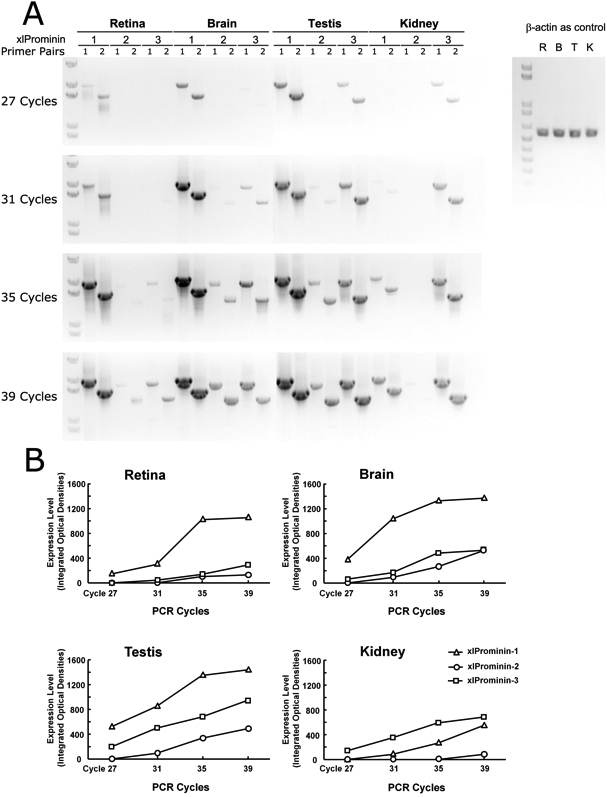
Figure 3. Semiquantitative reverse-transcription PCR analysis of xlProminin-1, 2, and 3 performed on the retina, brain, testis, and
kidney.
A: Aliquots (20 μl) of the PCR reaction were taken at the end of the 27th, 31st, 35th, and 39th cycles, separated and visualized
on a 1% agarose gel. Two independent primer pairs (see
Table 2) were used to amplify each xlProminin homolog in each tissue to ensure the specificity and efficiency of the PCR reaction.
A fragment of
Xenopus laevis β-actin cDNA was also amplified from equivalent starting material of total RNA to serve as a control. The Invitrogen 1KB
PLUS DNA (Cat. No. 10787–018) ladder was used for size standards.
B: Integrated signals in areas occupied by individual DNA bands were quantified and plotted to compare the relative expression
level of xlProminin-1, 2, and 3 in four
X. laevis tissues: the retina, brain, testis, and kidney. xlProminin-1, 2 and 3 are expressed in all four tissues. Among the three
prominin homologs, prominin-1 is predominantly expressed in the retina, brain, and testis, while prominin-3 is predominantly
expressed in the kidney. The expression level of prominin-2 is the lowest of the three prominin homologs in all examined tissues,
and is barely detectable in the kidney.
 Figure 3 of
Han, Mol Vis 2011; 17:1381-1396.
Figure 3 of
Han, Mol Vis 2011; 17:1381-1396.