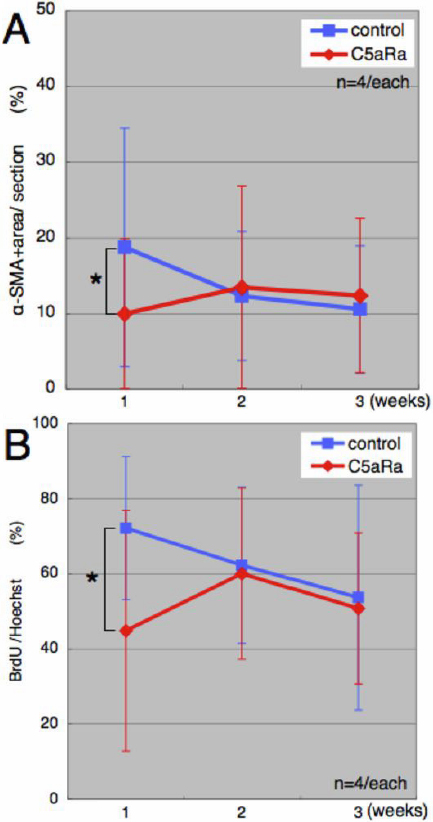
Figure 2. Quantitation of EMT and cell proliferation. Quantitation of a-SMA positive area (
A) and BrdU-positive cells (
B) in control (blue) and C5aR antagonist-treated animals (red). These graphs were made from sections received in the experiment
described in
Figure 1. Panel
A confirms that C5aR antagonist caused delay of EMT but also affected proliferation of lens epithelial cells as well. The asterisks
indicate the time when the results are statistically significant, p=0.042<0.05 for α-SMA and p=0.02<0.05 for BrdU/Hoechst.
 Figure 2 of
Suetsugu-Maki, Mol Vis 2011; 17:949-964.
Figure 2 of
Suetsugu-Maki, Mol Vis 2011; 17:949-964.