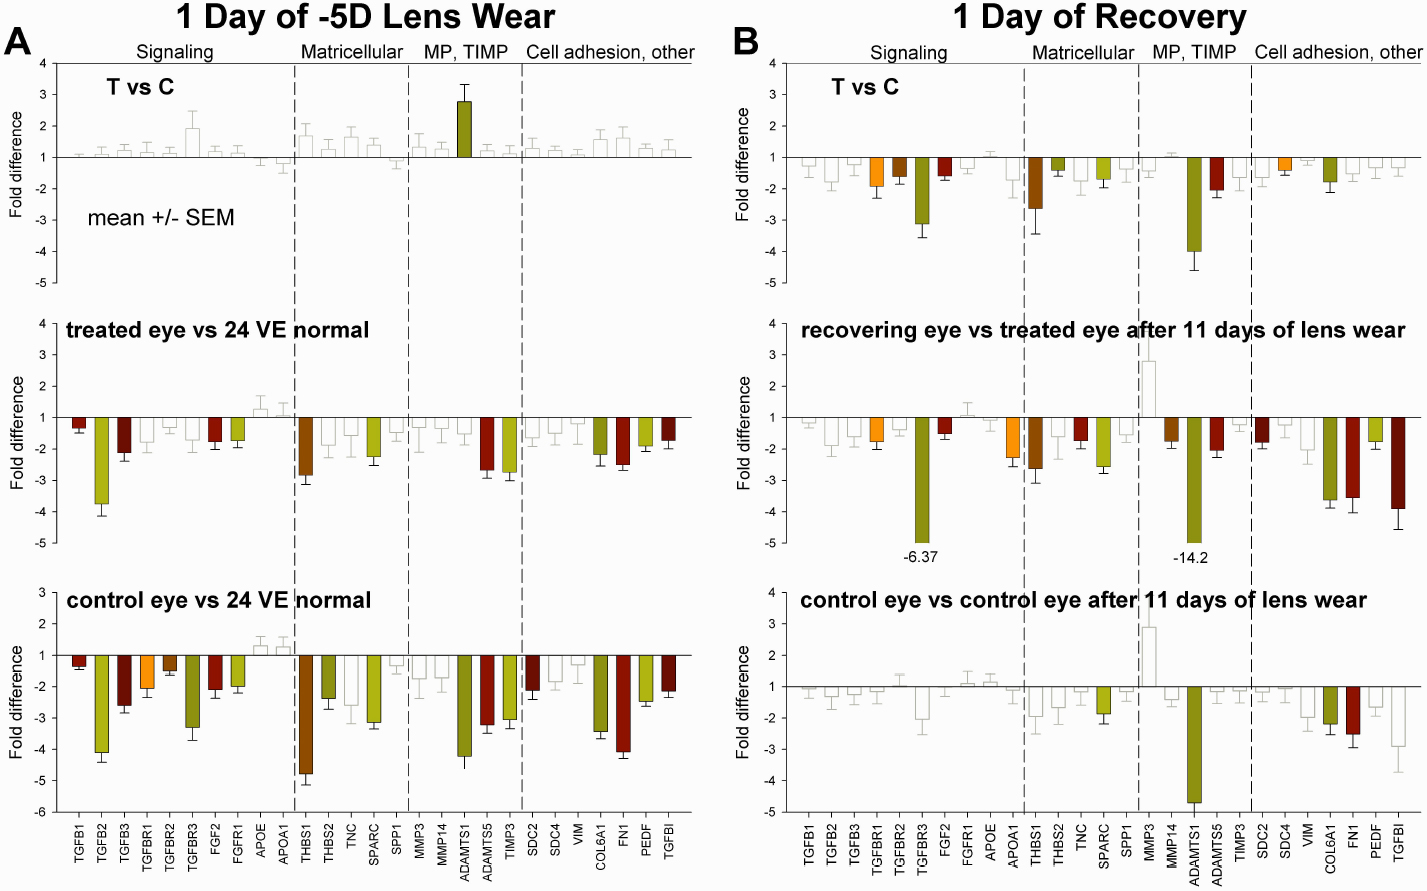
Figure 4. Summary of the early scleral mRNA responses.
A: Differences after one day of lens wear. Top row: Fold difference between the treated and control eyes after 1 day of –5D
lens wear, as shown in
Figure 2. Middle row: Treated eye scleral mRNA levels relative to those of eyes in the 24 VE normal group. Bottom panel: Control eye
scleral mRNA levels relative to those of eyes in the 24 VE normal group.
B: Differences after one day of recovery. Top row: Fold difference between the treated and control eyes after 1 day of recovery,
as shown in
Figure 2. Middle row: Treated eye scleral mRNA levels relative to treated eyes in the group with 11 days of –5D lens treatment. Bottom
panel: Control eye scleral mRNA levels relative to those of control eyes in the group with11 days of –5D lens treatment. Filled
bars indicate that the difference was statistically significant. Paired
t-test, p<0.05, for treated control eye comparisons (top panels); unpaired
t-test for other comparisons (middle and bottom panels). Unfilled, gray bars indicate differences that did not reach statistical
significance. Error bars indicate standard error of the mean (SEM).
 Figure 4 of
Gao, Mol Vis 2011; 17:903-919.
Figure 4 of
Gao, Mol Vis 2011; 17:903-919.