Figure 2. Summary of differential scleral mRNA expression levels in normal animals, in groups after 1, 4 and 11 days of –5D lens wear
and after 1 and 4 days of recovery from –5D lens wear. Filled bars indicate that mRNA expression was significantly higher
or lower in the treated eye than in the control eye (paired t-test, p<0.05). Unfilled, gray bars indicate differences that did not reach statistical significance. Error bars indicate
standard error of the mean (SEM).
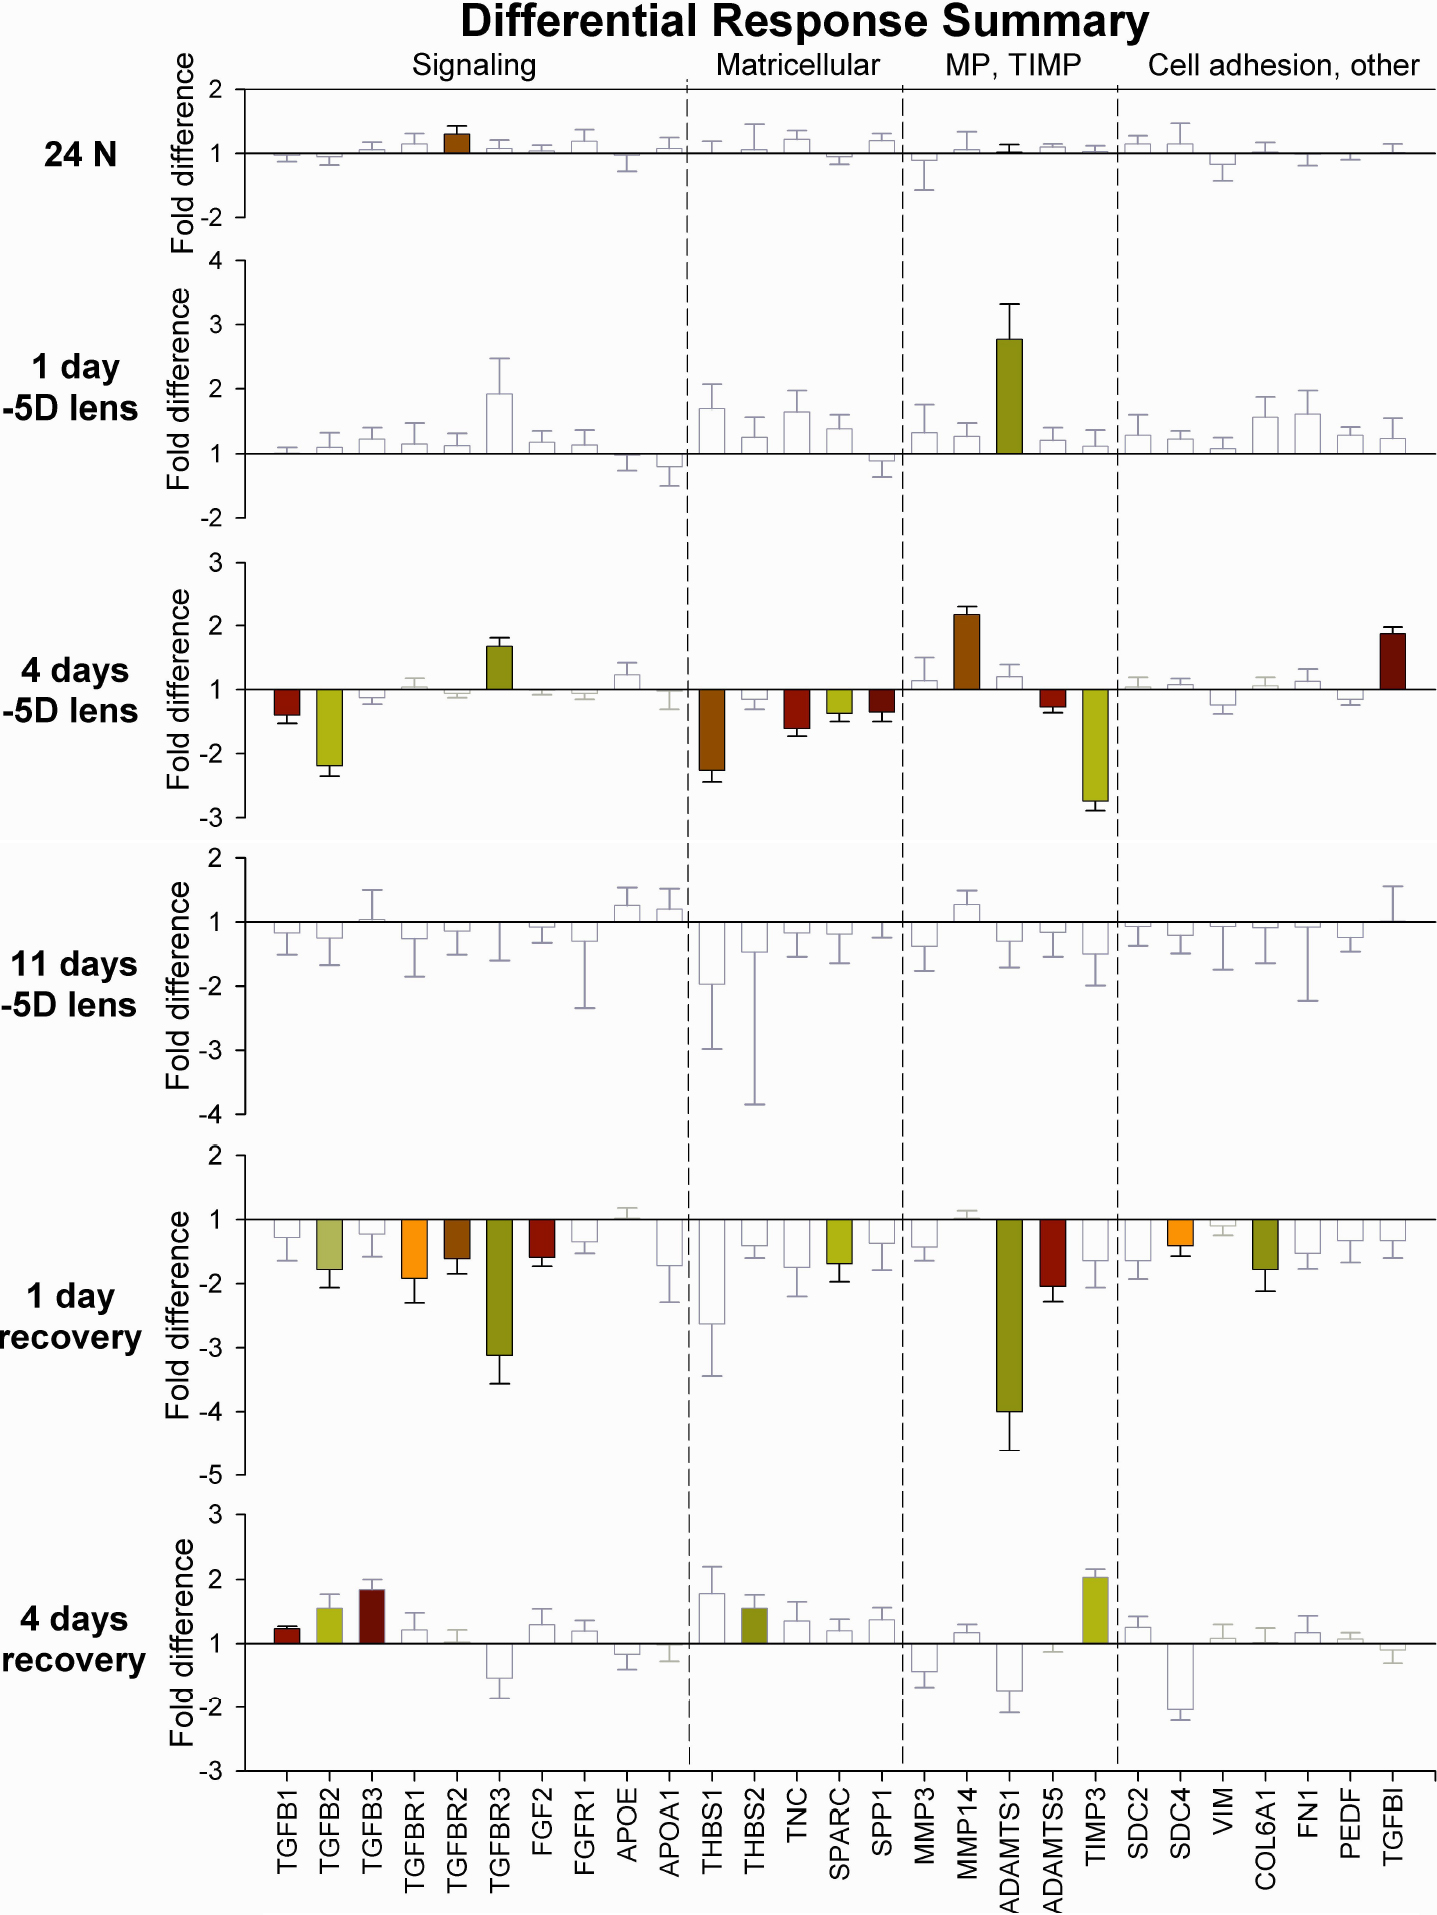
 Figure 2 of
Gao, Mol Vis 2011; 17:903-919.
Figure 2 of
Gao, Mol Vis 2011; 17:903-919.