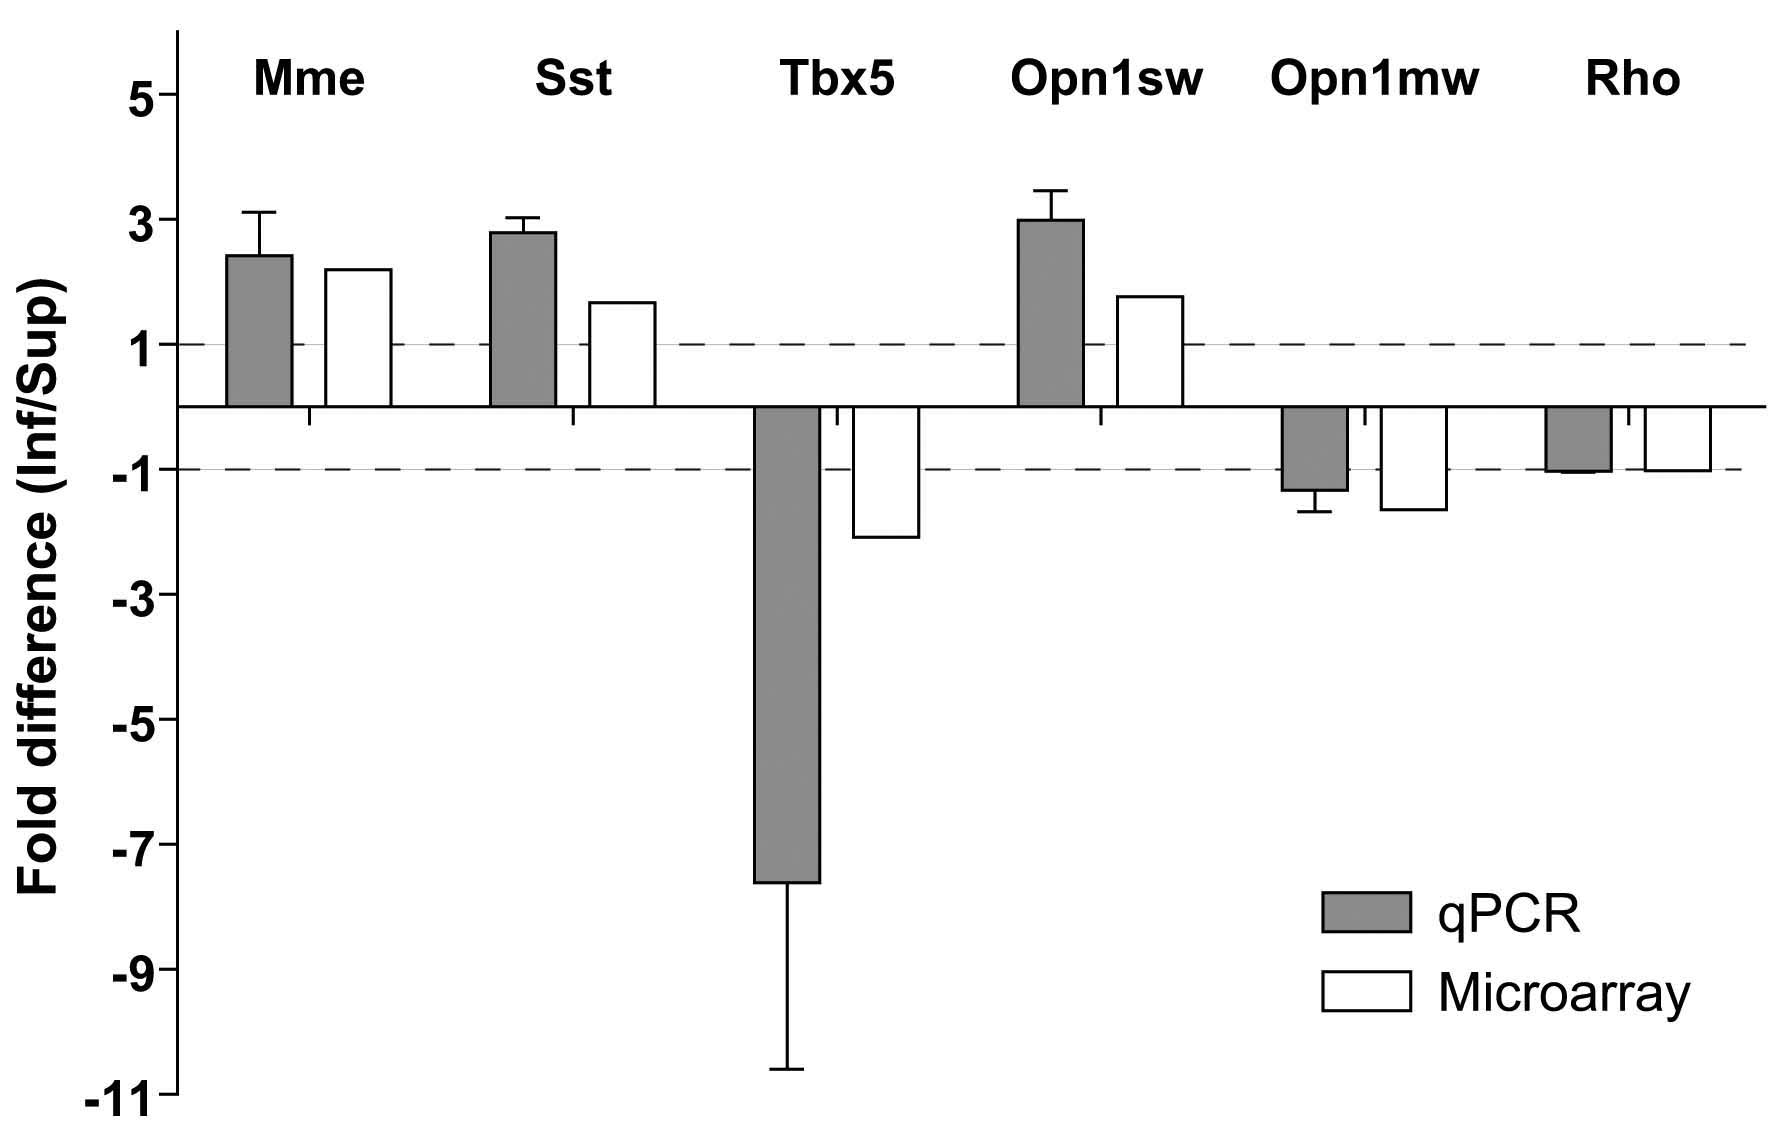
Figure 2. Quantitative PCR for microarray
validation. Array validation was performed by quantitative RT–PCR for 5
genes selected from the list in
Table 1. Rhodopsin was used as a
retina-relevant reference gene. qPCR is found in excellent agreement
with the outcome of microarray analysis. The results of qPCR were
averaged from three independent experiments, with the error bar
indicating the standard error of the mean. Dashed lines at fold
differences of 1 and −1 indicate no difference of gene expression
between the inferior and superior regions.
Zhu, Mol Vis 2010; 16:740-755. http://www.molvis.org/molvis/v16/a84
©2010 Molecular Vision http://www.molvis.org/molvis/
ISSN 1090-0535
 Figure 2 of Zhu, Mol Vis 2010; 16:740-755.