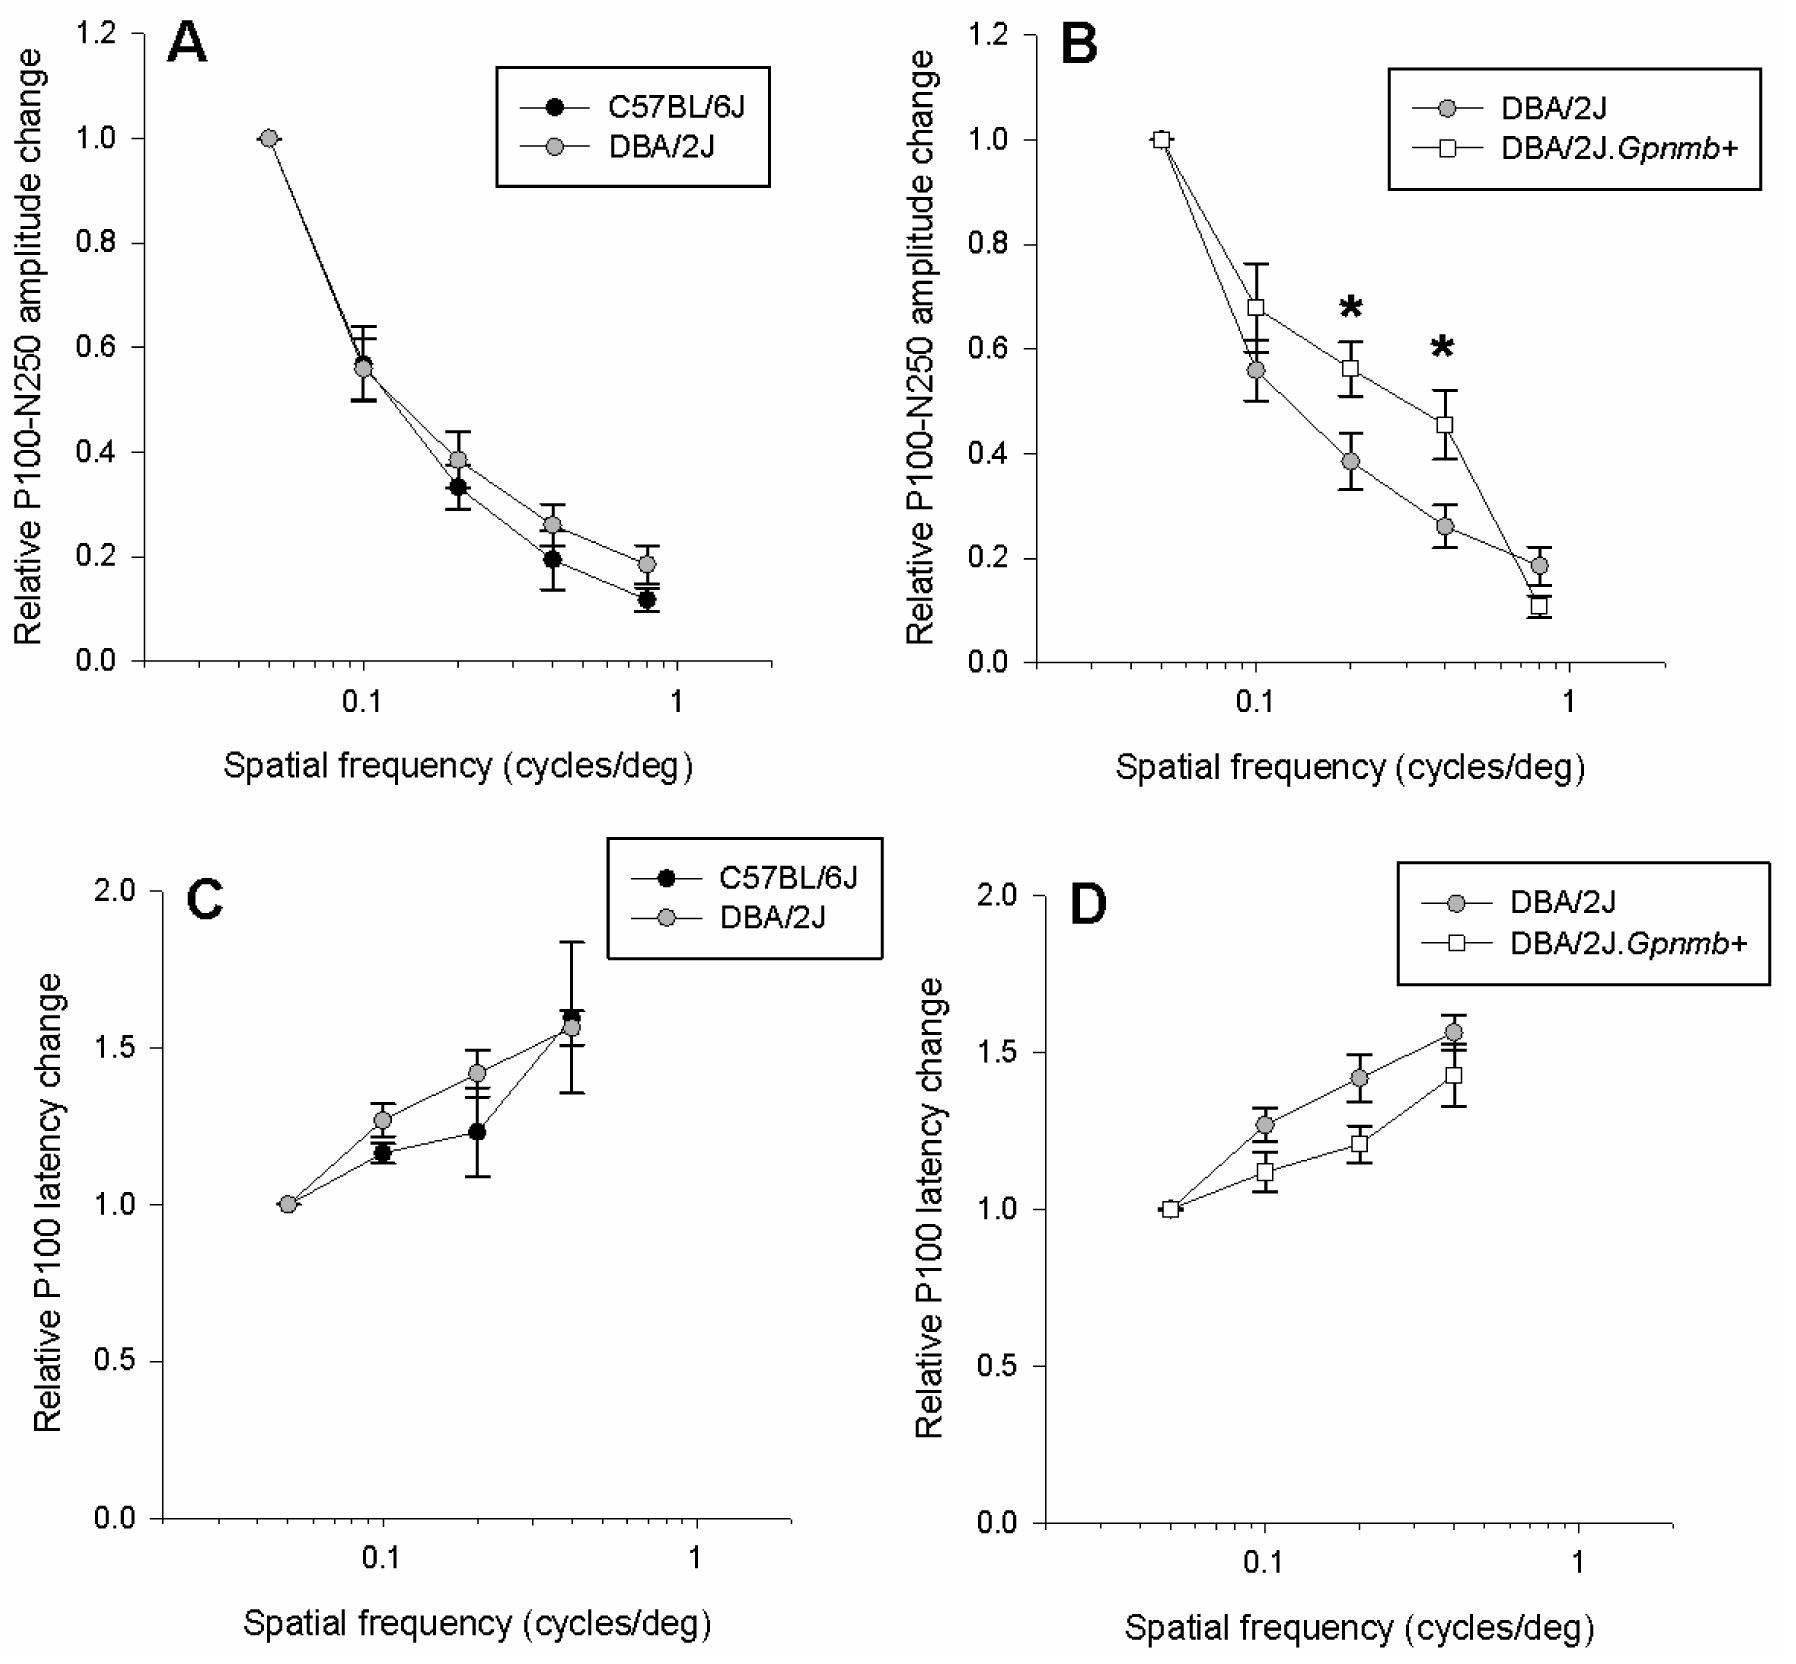
Figure 4. Spatial transfer function of
pattern electroretinogram (PERG) amplitude (
A,
B) and
latency (
C,
D) for different mouse strains. All
responses have been obtained at a fixed temporal frequency of 1 Hz and
contrast of 1.0. In all panels, symbols represent the mean±standard
error of the mean. Amplitude and latency changes are expressed in
relative units compared to the maximal PERG in response to gratings of
0.05 cycles/degree and contrast of 1.0 reversing at 1 Hz, corresponding
waveforms of which are shown in
Figure 1.
 Figure 4 of Porciatti, Mol Vis 2010; 16:2939-2947.