Figure 1. Pattern electroretinogram (PERG)
phenotype in C57BL/6J and DBA/2J mice. Grand-average waveforms of
maximal pattern electroretinograms recorded in different mouse strains
at 2–4 months of age (n=6 for each strain) in response to reversing
gratings (temporal frequency 1 Hz, spatial frequency 0.05 cycles/deg,
contrast 1.0). For all waveforms, the continuous black line represents
the grand average, and the superimposed dotted and dashed lines
represent the ±standard error of the mean. In the idealized waveform
(right panel), the upward arrow represents the amplitude of the
positive peak with latency of 90–120 ms (P100), the downward arrow
represents the amplitude of the negative trough with latency of 200–300
ms (N 250), and the horizontal arrow represents the implicit time of
the P100 component.
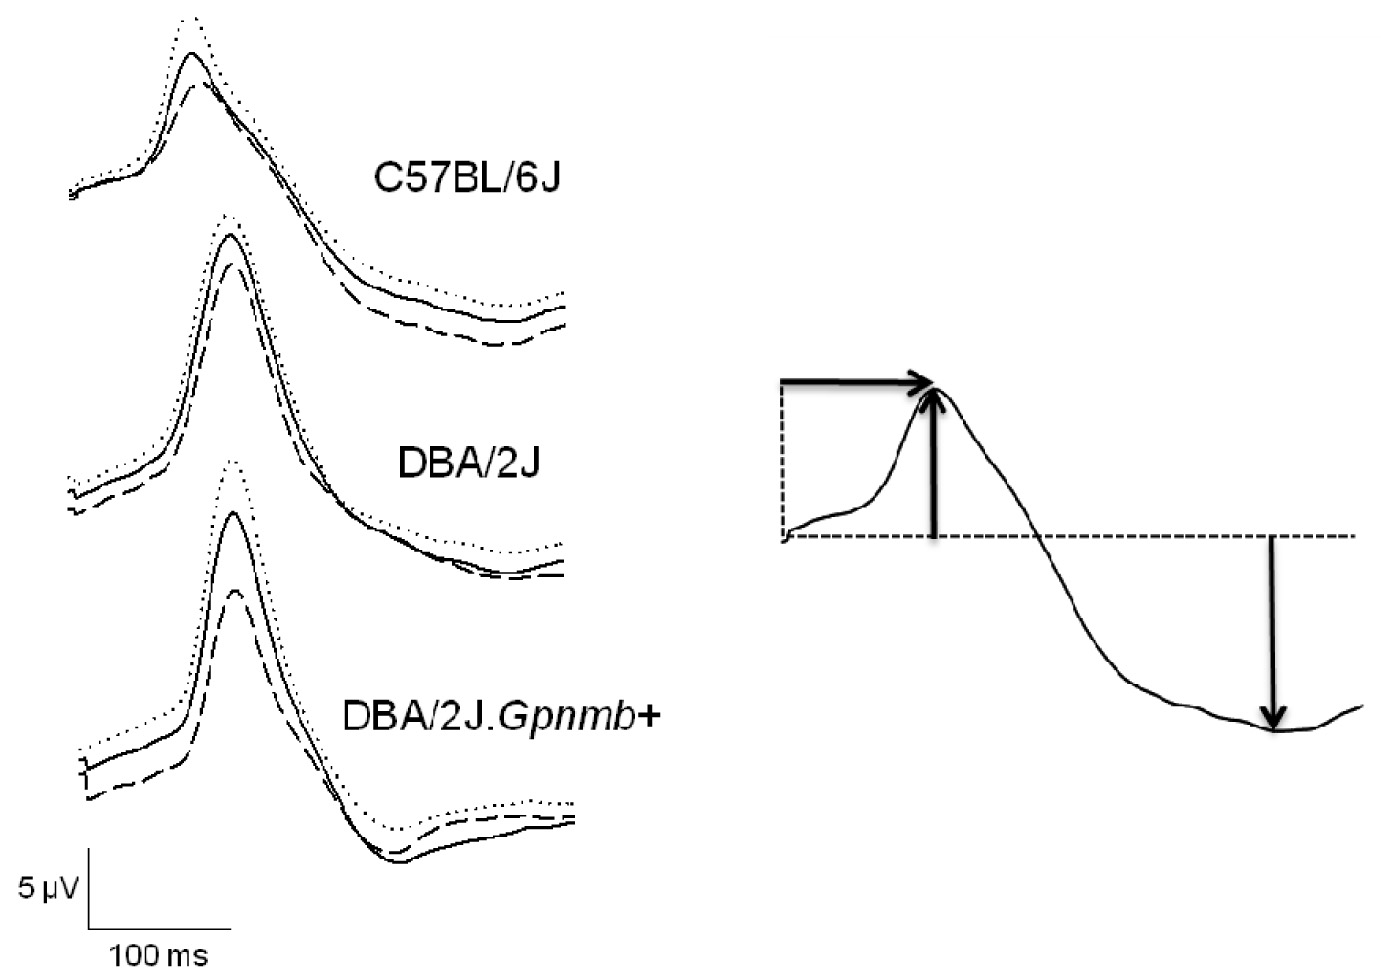
 Figure 1 of Porciatti, Mol Vis 2010; 16:2939-2947.