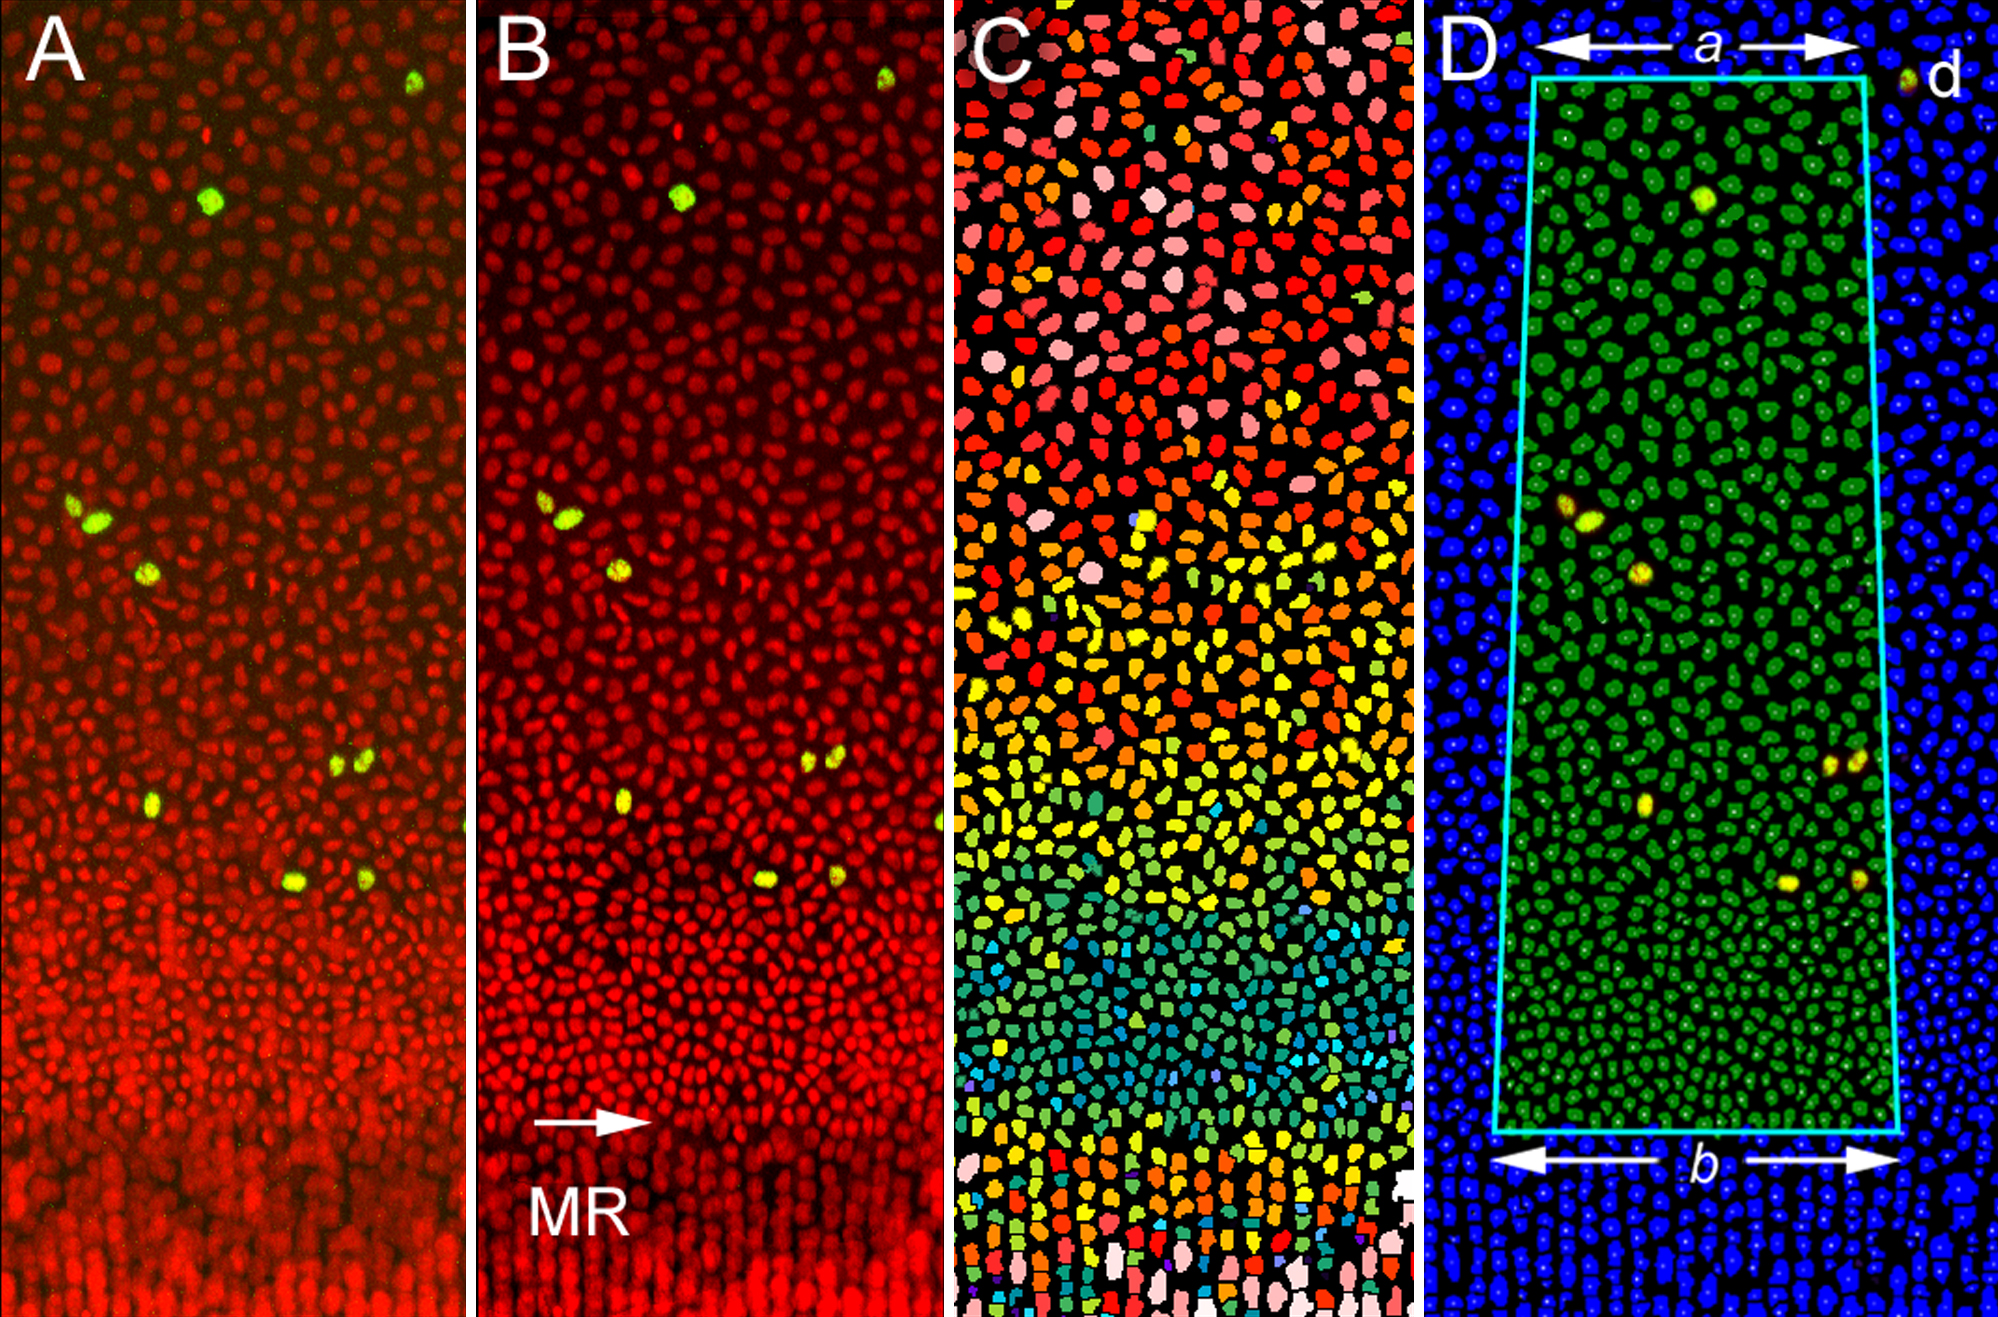
Figure 6. Quantification of epithelial
nuclei in orthographic projections of the equatorial lens region.
A:
Projection
of double-labeled lens tissue showing Edu-positive nuclei
(yellow) and Draq5-stained nuclei (red).
B: Three-dimensional
editing of the original image stack removes the underlying fiber cell
nuclei and clarifies epithelial nuclear fluorescence, facilitating
automated counting. An arrow indicates the border between the
epithelial cell nuclei and those of young fiber cells in the meridional
rows (MR).
C: Epithelial nuclei are identified automatically
and color-coded according to size. Note the densely packed nuclei (blue
green color) near the border of the epithelium.
D: An isosceles
trapezoid is defined in the center of the projection. The width of the
trapezoid corresponds to 10° of longitude (See
Figure 2).
Sides
a and
b are oriented parallel to the lens
equator. Side
a is positioned level with the fiduciary cell,
d
(see
Figure 4)
and
side
b is located at the border between the epithelium and
the meridional row cells. Nuclei (green) with centroids lying within
the trapezoid are included in the count.
 Figure 6 of Bassnett, Mol Vis 2010; 16:2294-2300.