Figure 2. Orthographic projections. A: Orthographic azimuthal projection of the globe, polar aspect. B: Orthographic azimuthal projection of the globe, equatorial aspect. C: Orthographic projection of a lens, showing an oblique view of the anterior surface. The epithelium is arbitrarily divided
into two regions: a spherical cap (yellow) and an equatorial band (blue). The number of cells in the spherical cap is calculated
from cell counts made on a 60°-wide anterior sector (AS). The number of cells in the equatorial band is determined by cell
counts made on a 10°-wide equatorial sector (ES). The border between AS and ES is marked by the position of a fiduciary, EdU-positive
nucleus (red dot). See text for details.
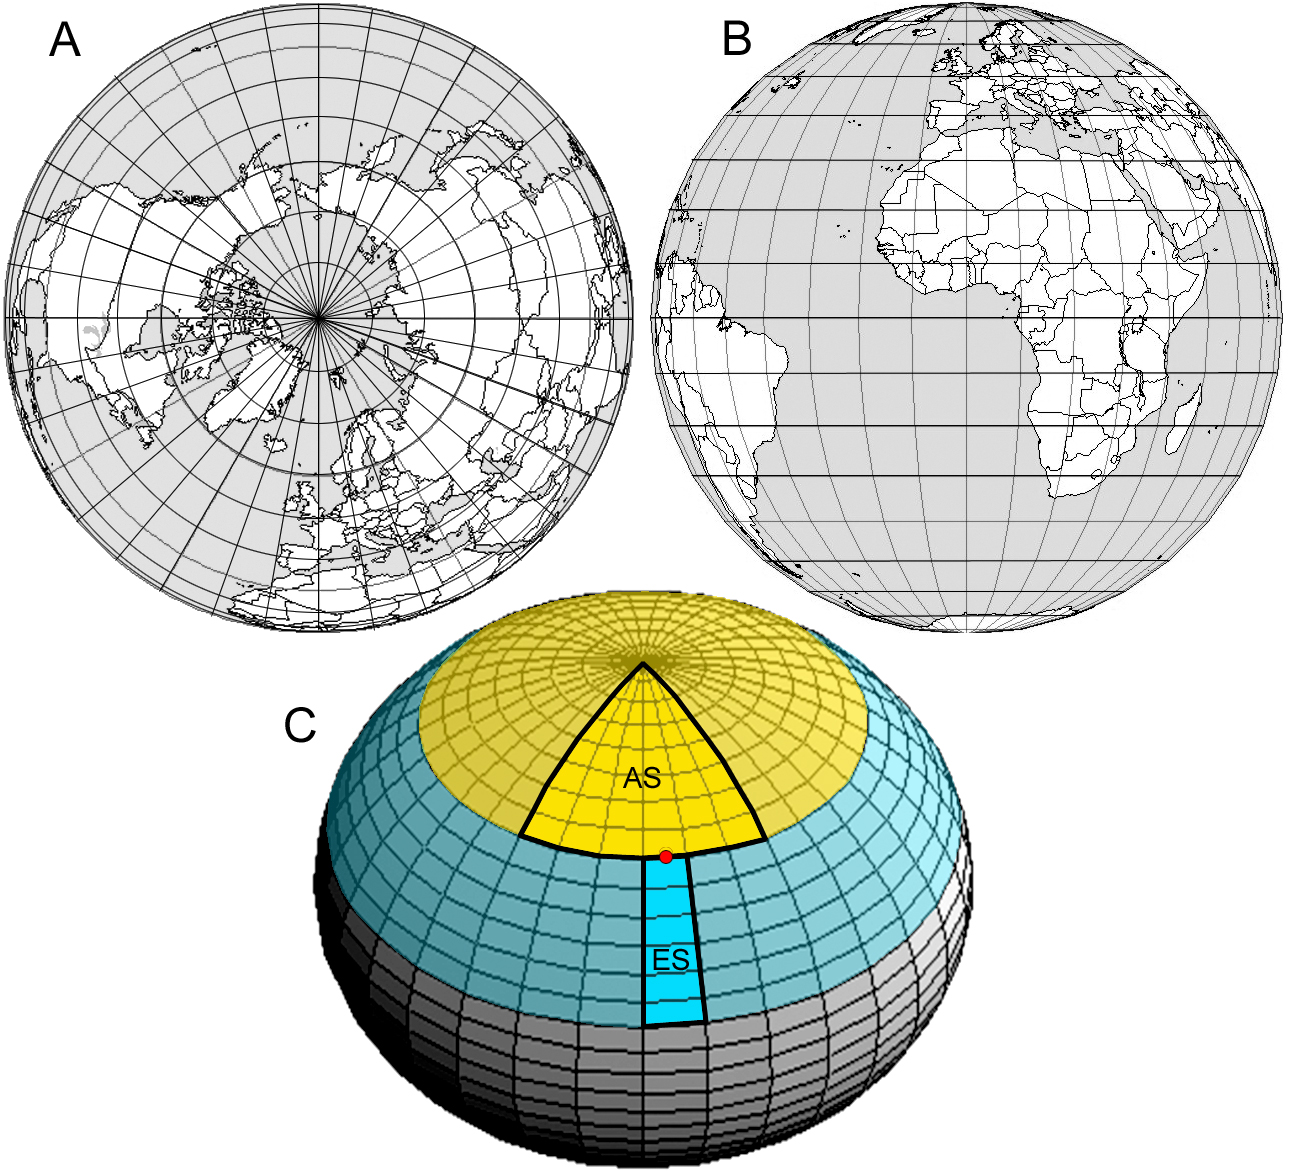
 Figure 2 of
Bassnett, Mol Vis 2010; 16:2294-2300.
Figure 2 of
Bassnett, Mol Vis 2010; 16:2294-2300.