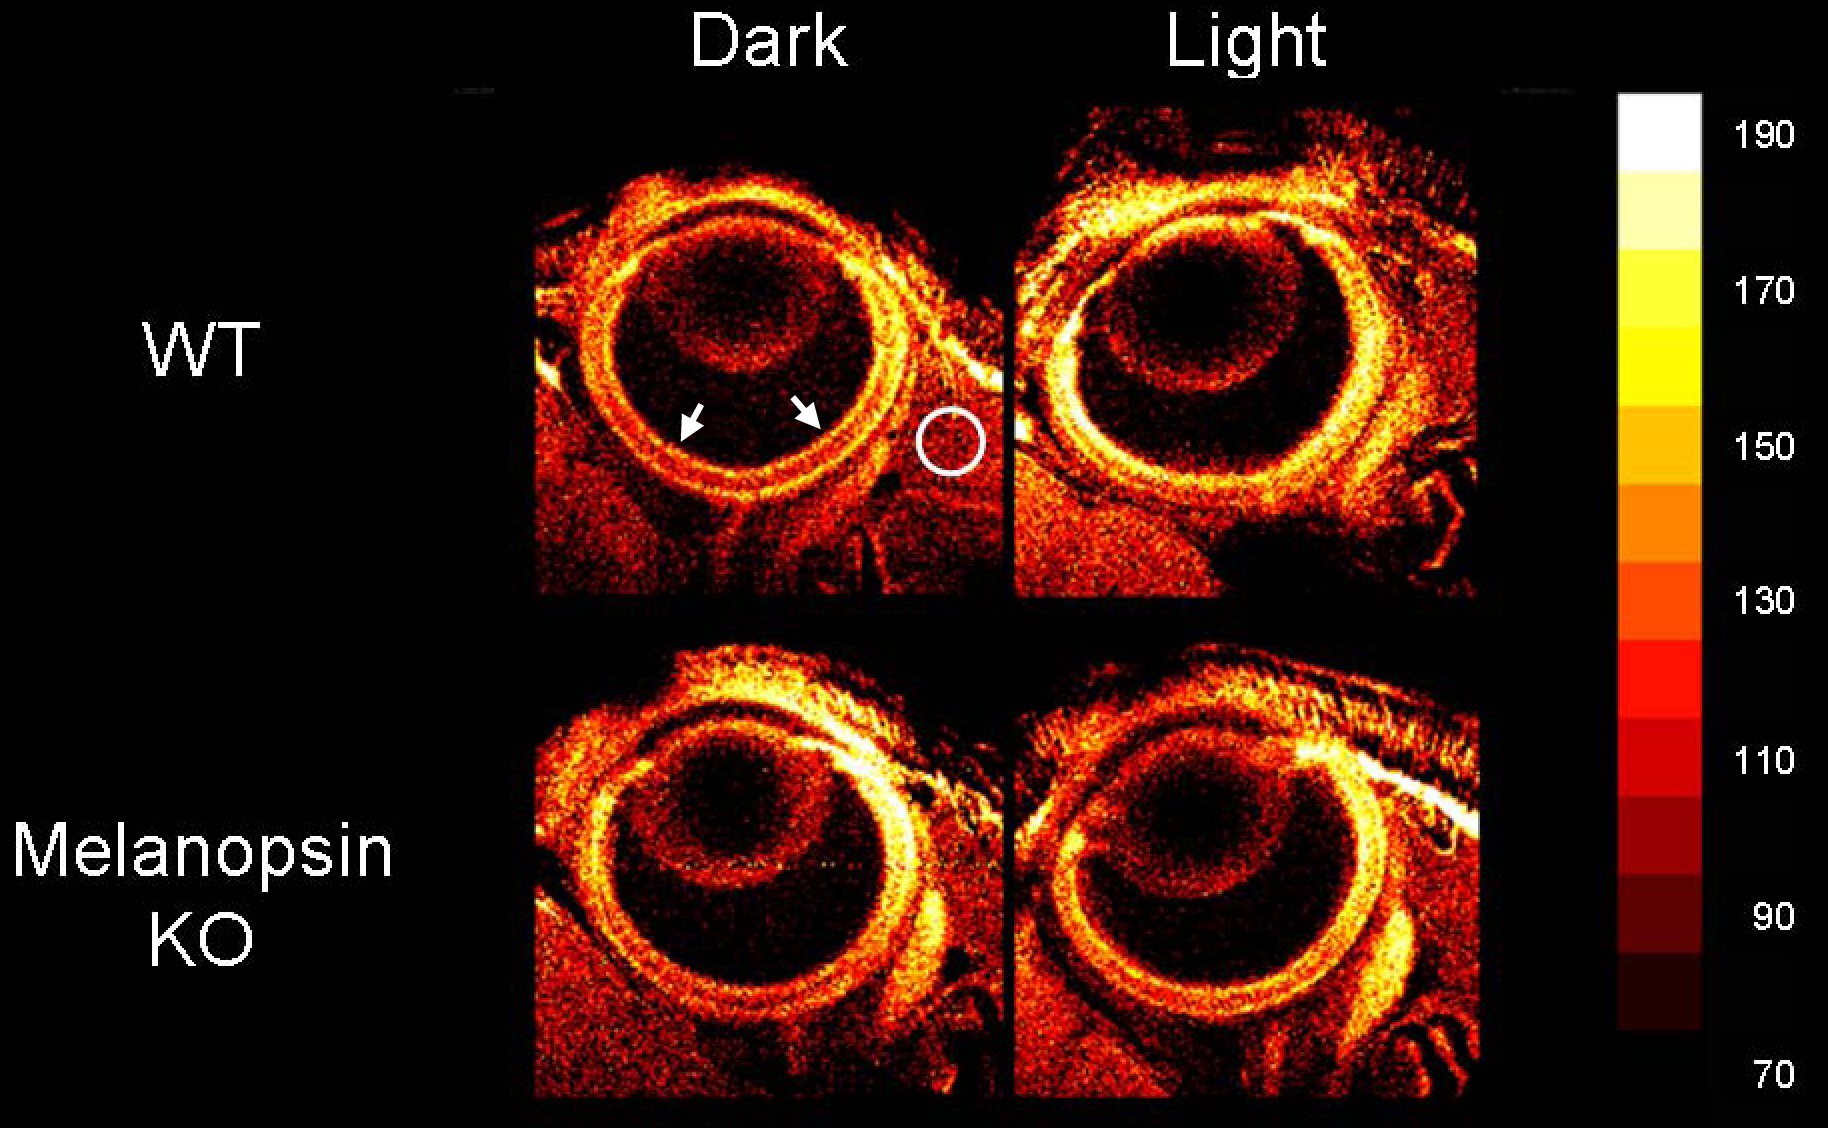
Figure 1. Representative
manganese-enhanced MRI (MEMRI) data of P7 wild type (WT; top row) and
melanopsin knock out (KO; bottom row) mouse eyes following either dark
(left column) or light (right column) adaptation. The white circle
indicates the region of extraocular muscle used to normalize retinal
signal intensities in this figure and in
Figure 2. The same
muscle-normalized signal intensity scale (far right) was used for all
images and in all analyses. Retinal signal intensity data in
Figure 2
were extracted from the central retina (0 to 30% of the panretinal
extent or the region between the arrows). The width of each image is
4.14 mm.
 Figure 1 of Berkowitz, Mol Vis 2010; 16:1776-1780.