Figure 2. Retinal signal intensity data,
normalized to muscle, for light (blue symbols (means) and lines (SEMs))
and dark (black symbols (means) and lines (SEMs)) plotted as a function
of distance from the vitreous-retina border (0%) to the retinal-choroid
border (100%) for wild type (WT; left graph) and knock out (KO; right
graph) mice. The red line indicates the retinal region demonstrating a
significant difference (p<0.05) between light- and dark-adapted WT
mice.
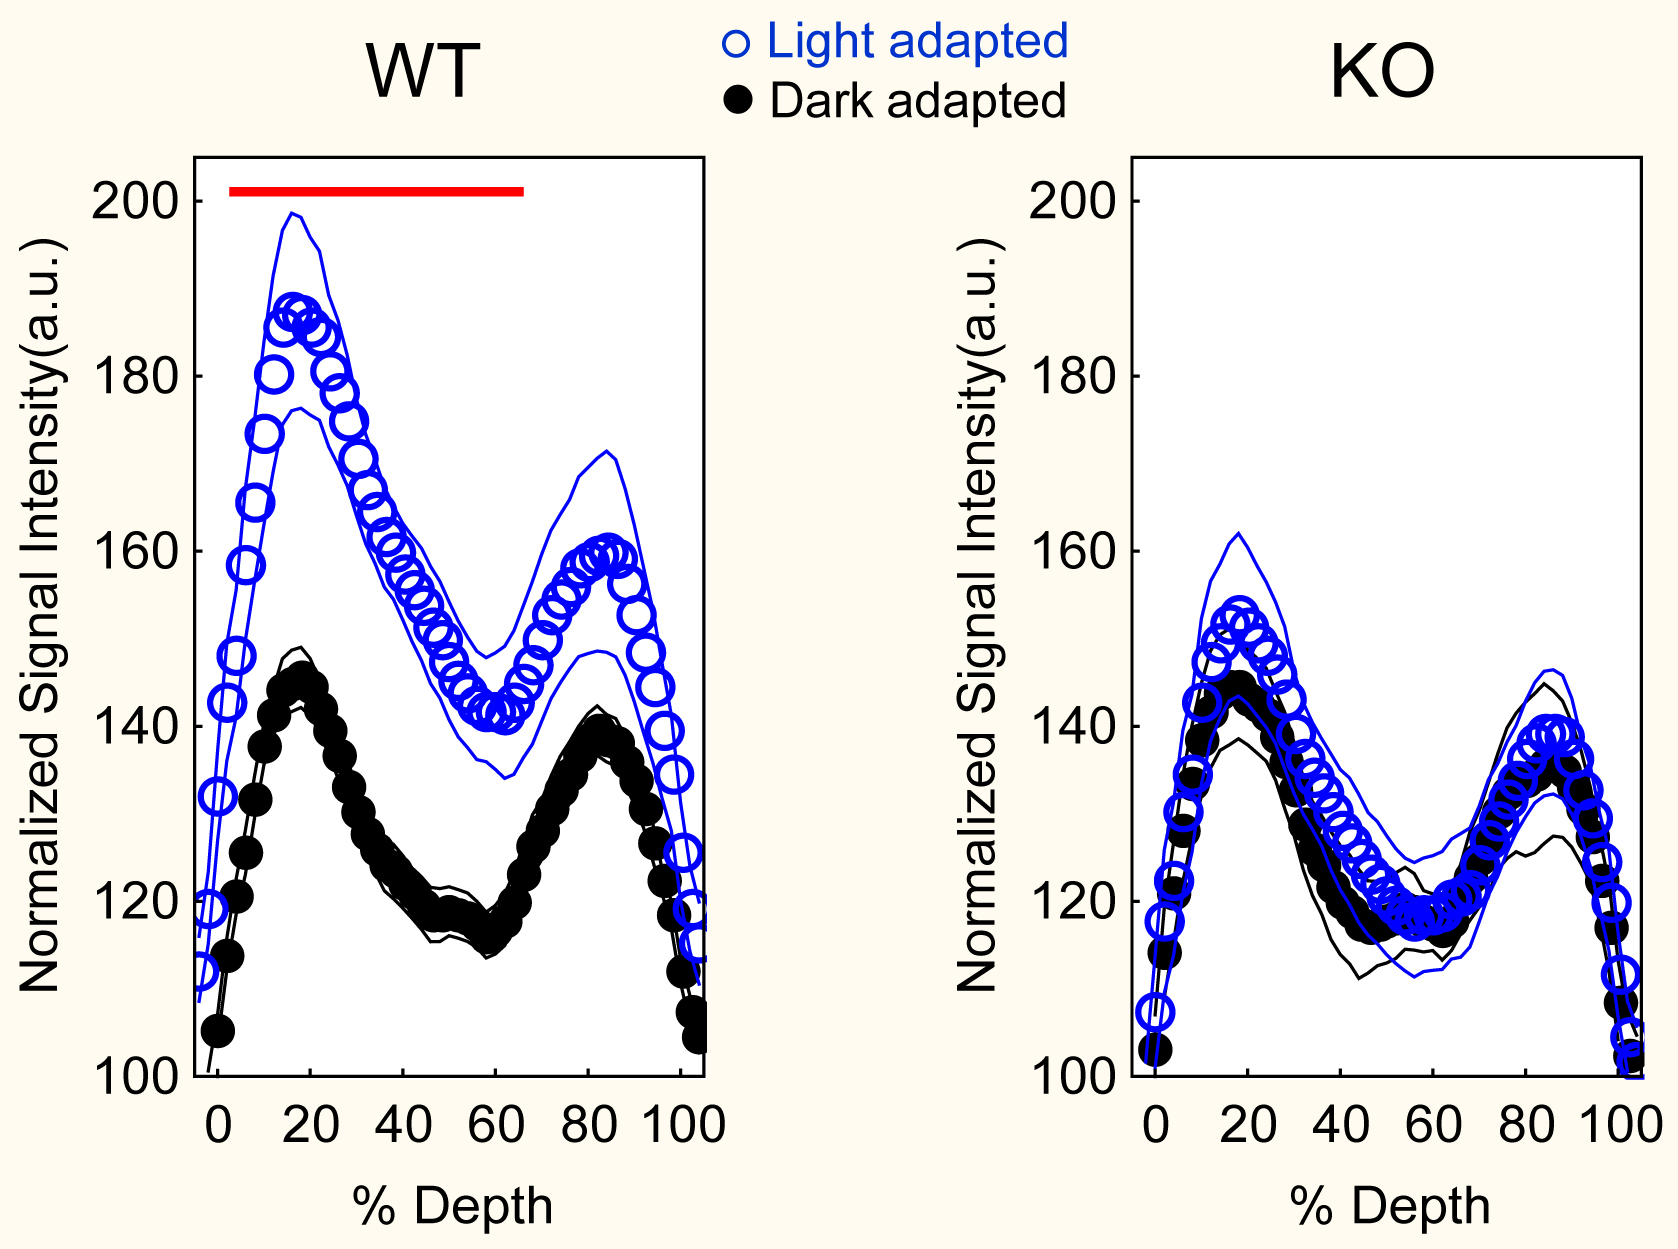
 Figure 2 of Berkowitz, Mol Vis 2010; 16:1776-1780.