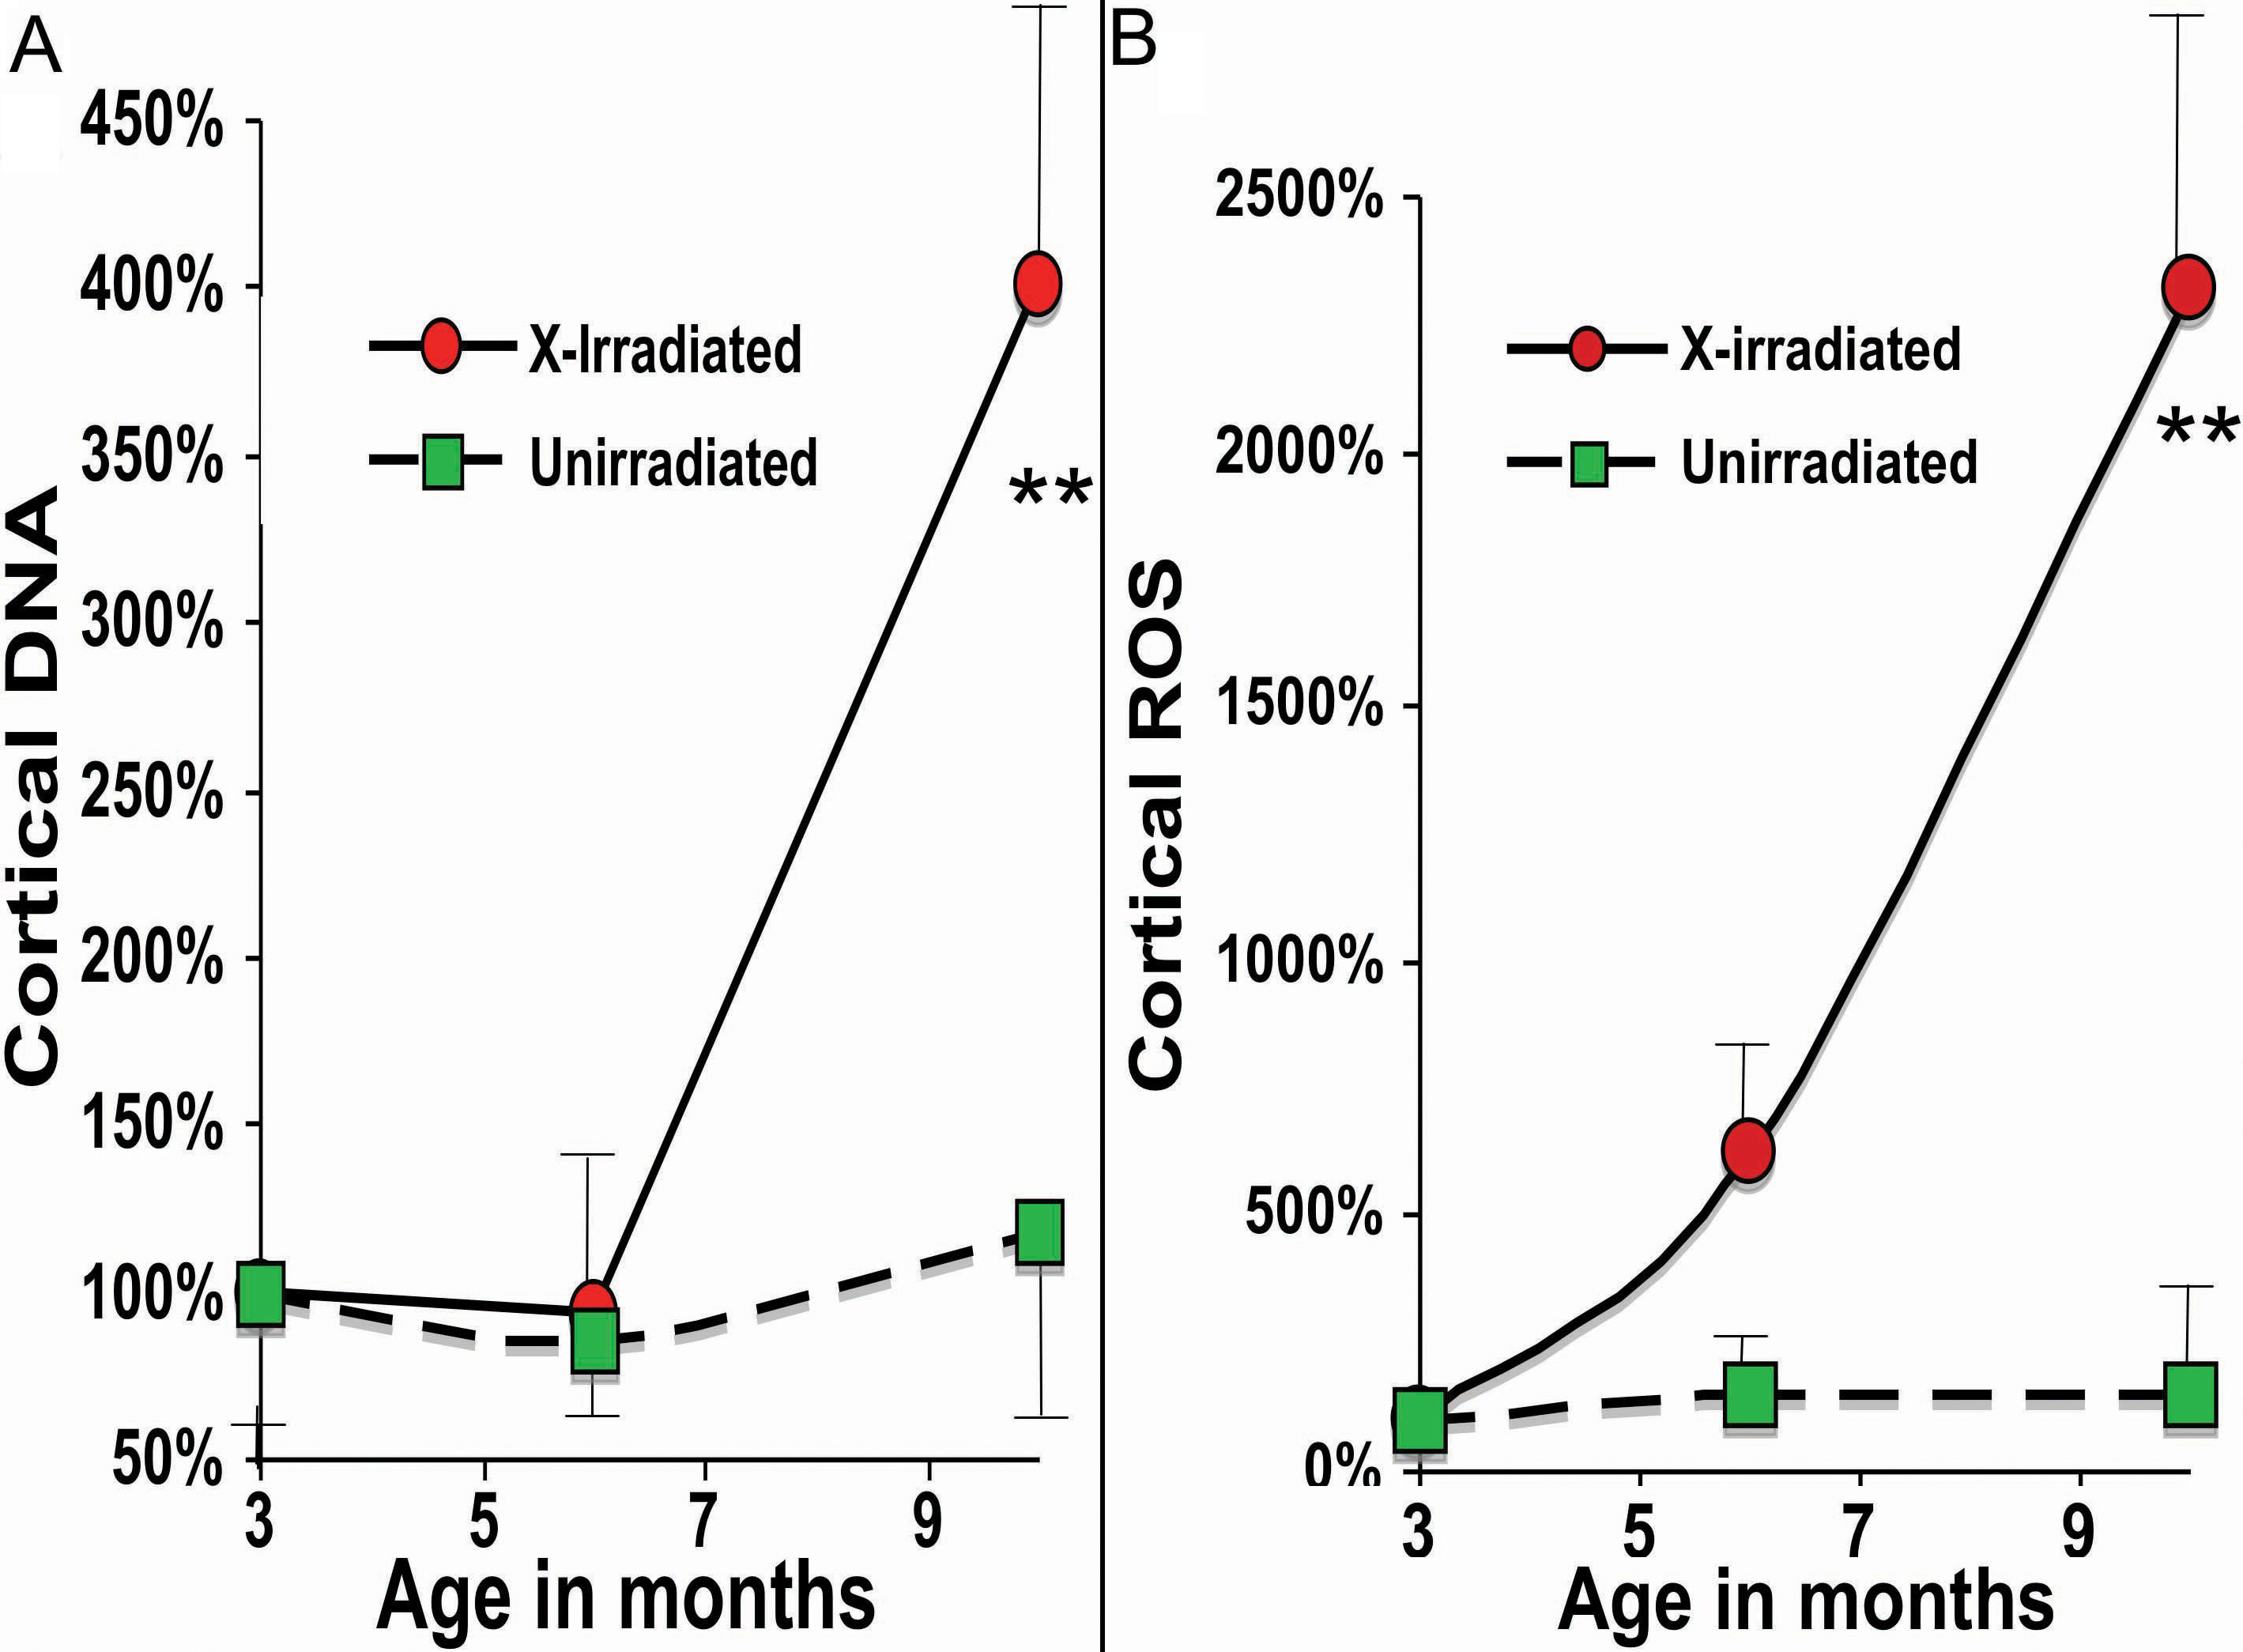
Figure 6. Increases in cortical DNA and
ROS following X irradiation at 3 months of age. Vital staining of fresh
lenses for ROS and DNA were carried out with the same stains shown
described in the legend to
Figure 5. The data are
presented as per cent of 3-month controls (see Methods). Red circles
are for lenses X-irradiated at 3 months and green squares are for
unirradiated age-matched controls. Error bars represent standard error
of the means, and stars indicate a significant difference from control
values using 1 tail Mann–Whitney test (**, p<0.01). Each point
represents the mean of 4–6 mice analyzed.
 Figure 6 of Pendergrass, Mol Vis 2010; 16:1496-1513.