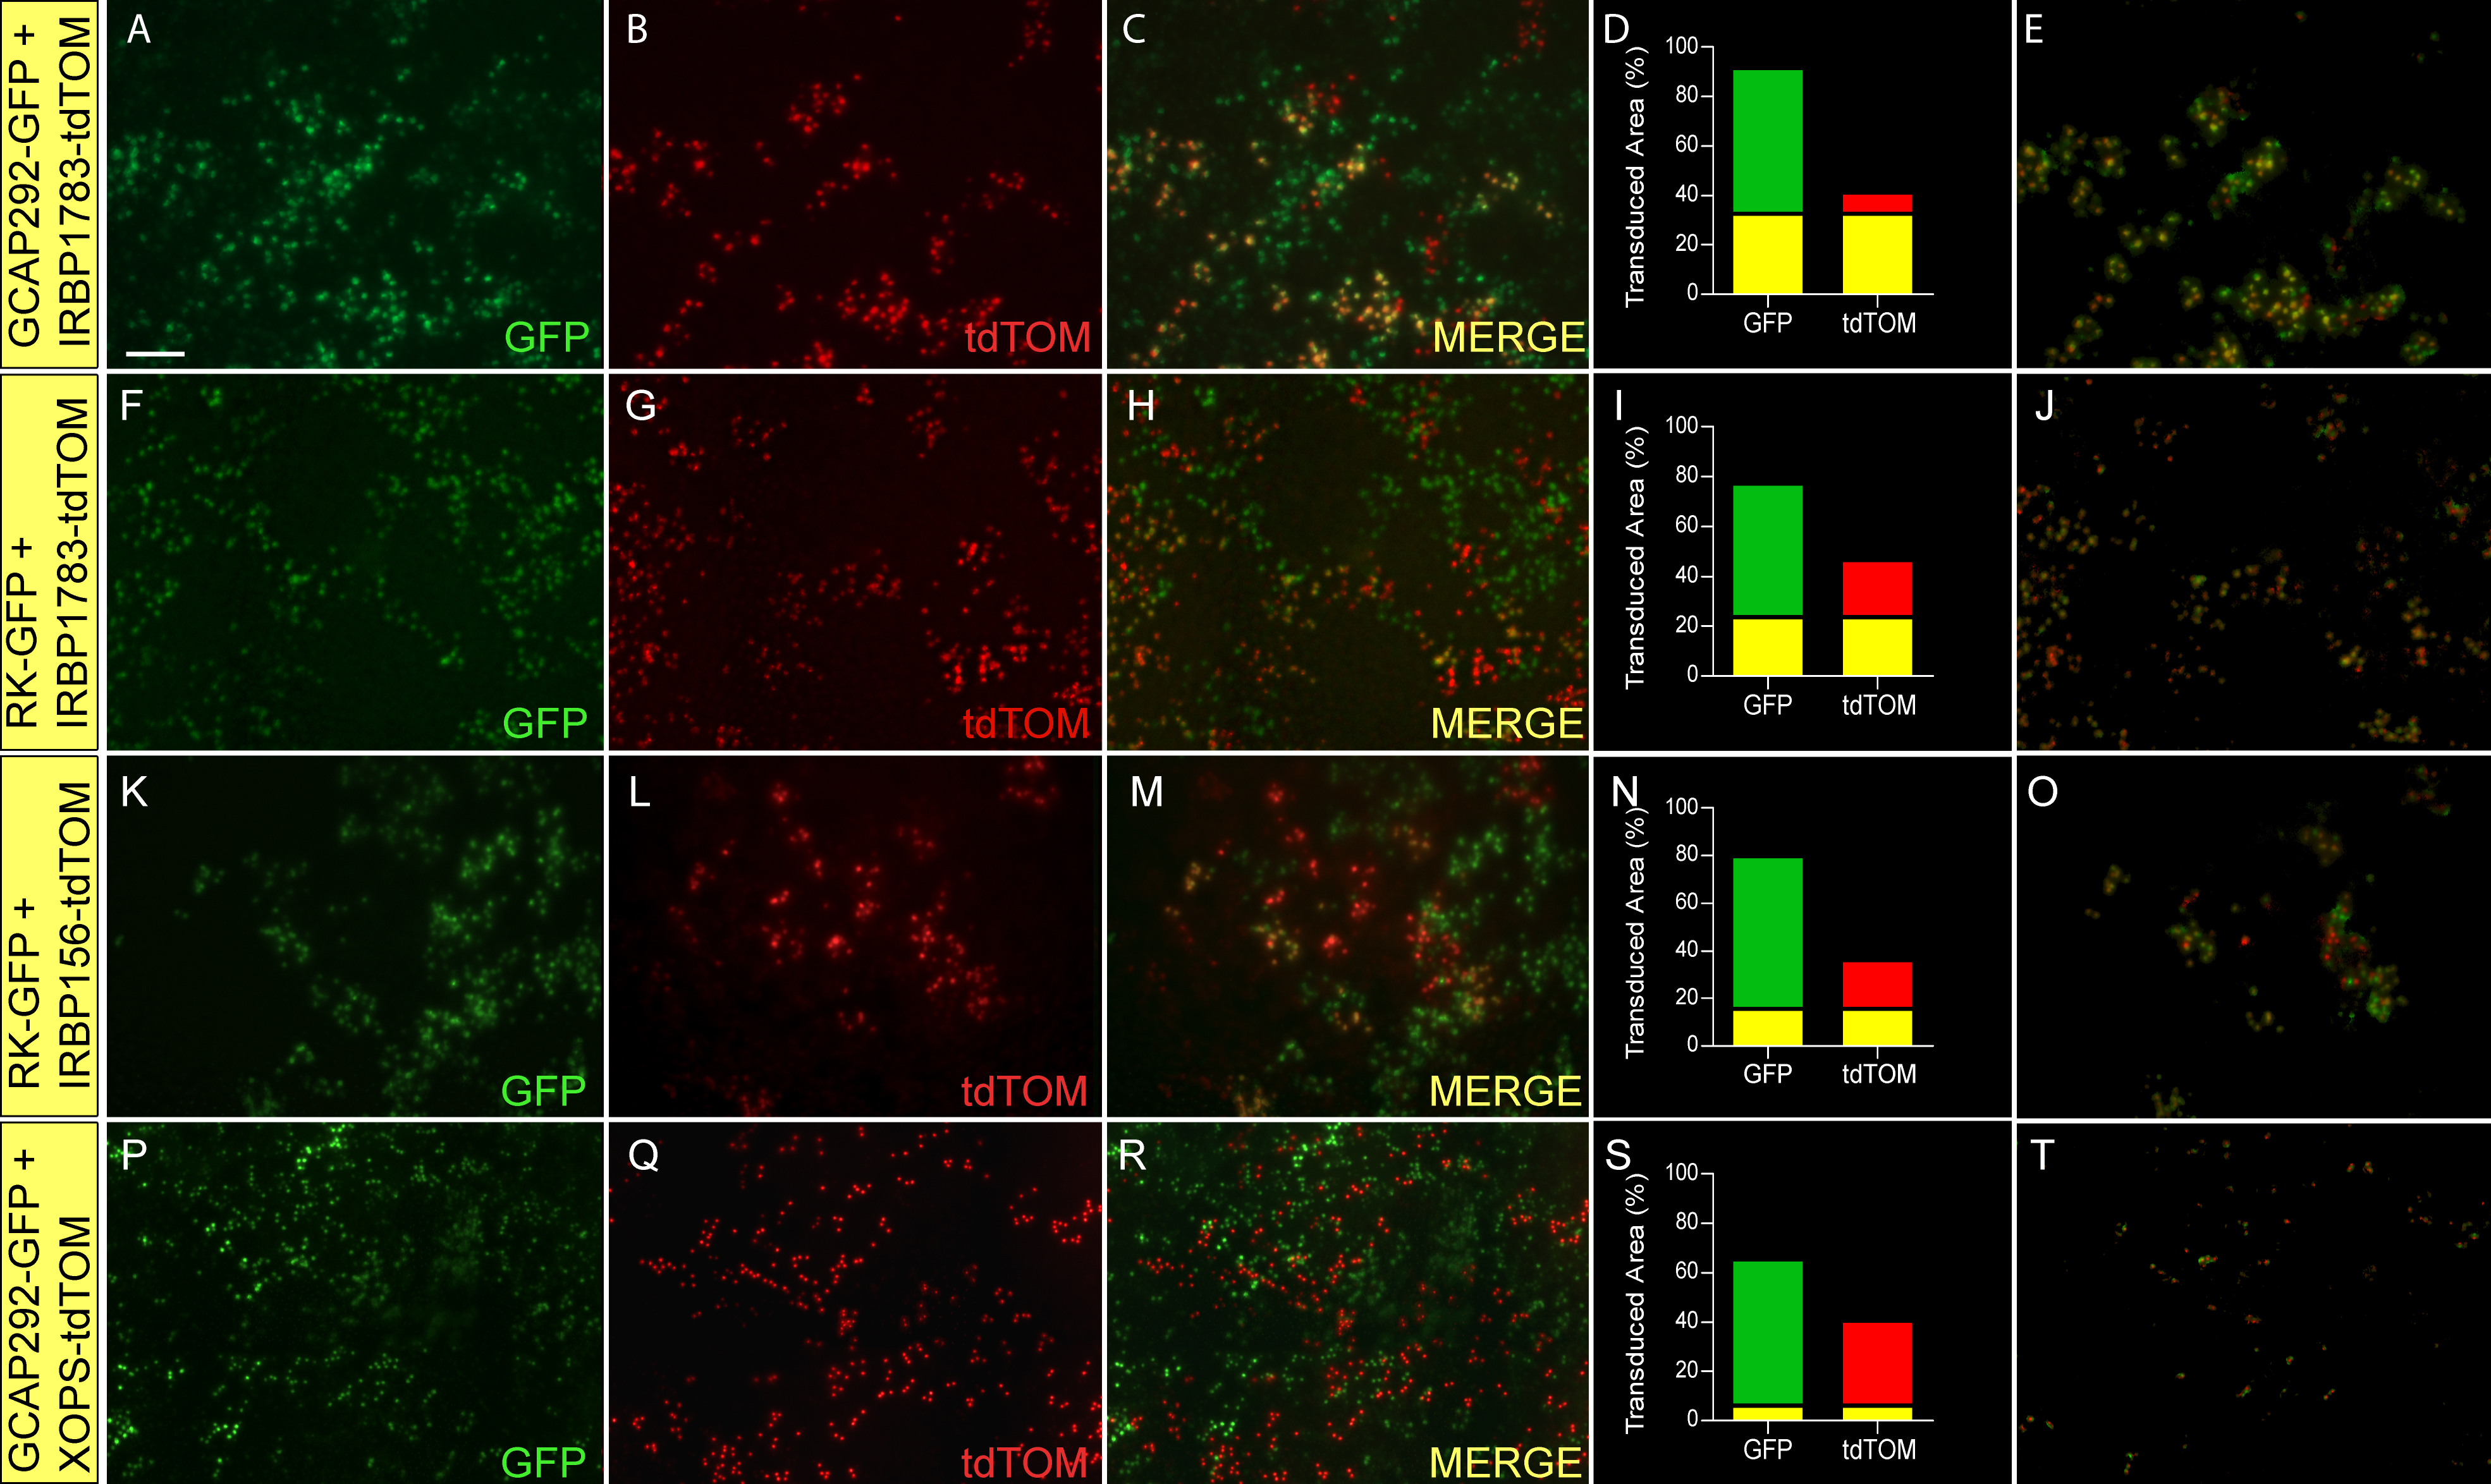
Figure 3. Expression of photoreceptor
promoter-driven fluorescent proteins in retinas transduced with
mixtures of two lentiviruses. Lentiviral vectors carrying transgenes
comprised of various photoreceptor promoters driving expression of GFP
or tdTOM fluorescent proteins were mixed in equal volumes and injected
into the developing neural tubes of chicken embryos (embryonic day 2
–E2) in ovo. The injected virus mixtures were as follows:
A-E:
pFIN-GCAP292-GFP (2.2×10
10 vector genomes/µl) and
pFIN-IRBP1783-tdTOM (1.6×10
10 vector genomes/µl);
F-J:
pFIN-RK-GFP-WPRE
(1.2×10
10 vector genomes/µl) and
pFIN-IRBP1783-tdTOM (1.6×10
10 vector genomes/µl);
K-O:
pFIN-RK-GFP-WPRE
(1.2×10
10 vector genomes/µl) and
pFIN-IRBP156-tdTOM (5.6×10
10 vector genomes/µl);
P-T:
pFIN-GCAP292-GFP
(2.2×10
10 vector genomes/µl) and
pFIN-XOPS-tdTOM (1.2×10
9 vector genomes/µl). We have
previously shown that the GCAP292 and IRBP1783 promoters are active in
cone cells [
18].
RK and IRBP156 are active in both rod and cone cells and XOPS is only
active in rod cells (
Figure 1). For each image
series, the transduced retina was photographed from the photoreceptor
side of the whole mount using GFP (
A,
F,
K,
P)
and
CHER (
B,
G,
L,
Q) filters. These
images were then merged to identify cells expressing both reporter
proteins (
C,
H,
M,
R). The merged images
were analyzed using the co-localization module of the Zeiss AxioVision
Image Suite. The results of these analyses are expressed as the percent
of the transduced area in the image (pixels) containing co-localized
GFP and tdTOM (yellow bar) or GFP (green bar) or tdTOM (red bar)
fluorescence alone (
D,
I,
N,
S). The
images shown in
E,
J,
O, and
T were
extracted from the merged images shown in
C,
H,
M,
and
R and show only those areas of the merged image in which
GFP was co-localized with tdTOM. The scale bar shown in
A is
applicable to all images and equals 50 µm.
 Figure 3 of Semple-Rowland, Mol Vis 2010; 16:916-934.