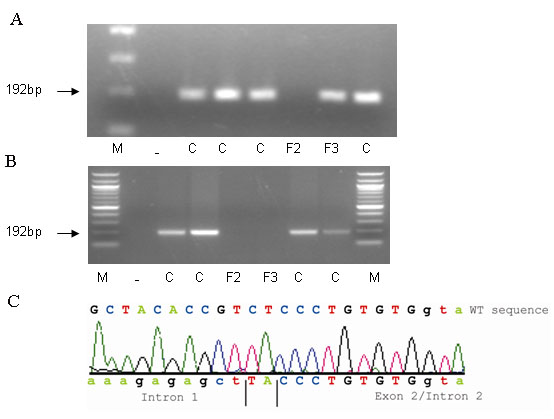
Figure 5. Analysis of the hybrid gene in Family 2.
A and
B show agarose gel photographs of PCR products (192 bp) obtained using primer pairs (
Table 1) specifically designed to amplify either L exon 2 (
A) or M exon 2 (
B). Individual 1.1 of Family 2 is represented by sample F2 on the gels. No amplification products were obtained for sample
F2 with either L opsin gene specific primers (
A) or M opsin gene specific primers (
B), indicating absence of exon 2 of both L and M opsin genes in Family 2. Sample F3 represents subject 2.3 of Family 3, who
has a hybrid gene in which L exon 2 is present (
A) but M exon 2 (
B) is absent. These data confirm the absence of both L and M exon 2 in sample F2 (1.1 Family 2) and the presence of L exon
2 and absence of M exon 2 in sample F3 (2.3 Family 3). C denotes male population control sample. Dash (–) denotes a DNA negative
control sample, and M indicates a 100 bp DNA ladder.
C shows sequence of individual 1.1 in Family 2 in which the deletion breakpoint within exon 2 was detected. The subject sequence
was compared to the wild type (WT) reference sequence demonstrating that the majority of exon 2 is deleted; intron 1 sequence
was joined to terminal exon 2 sequence with 2 bp of intervening sequence.
 Figure 5 of
Gardner, Mol Vis 2009; 15:876-884.
Figure 5 of
Gardner, Mol Vis 2009; 15:876-884.