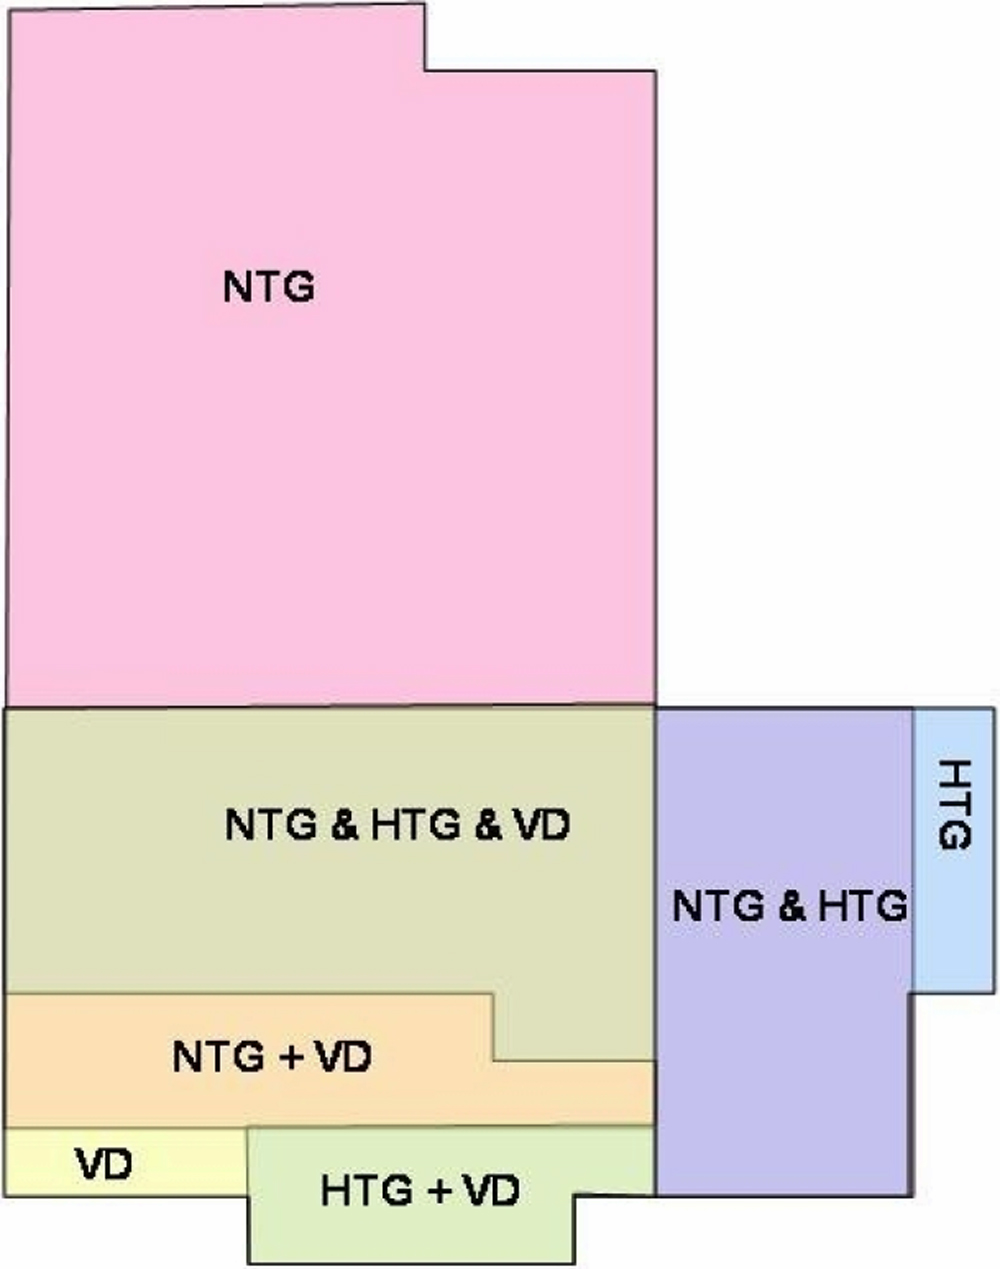
Figure 3. Overview of protein expression
profiling. The diagram demonstrates the overlap in molecular mechanisms
among single pathologies according to the similarities in gene
expression patterns in vascular deregulation (VD), normal-tension (NTG)
and high-tension (HTG) glaucoma patients groups. Single disorders
demonstrate some pathology-characteristic expressions marked by the
corresponding symbol, e.g., NTG. Further, there are partial expression
overlaps between two of three pathologies symbolized by the
corresponding pair, e.g., NTG & HTG. The similarities among all
three groups (NTG & HTG & VD) of comparison are considered as
the central issue that this study is focused on. Altogether 34 genes
that create this overlap are summarized in
Table 3, providing the clue
to the molecular pathomechanisms that potentially predispose
vasospastic individuals to the glaucomatous pathology.
 Figure 3 of Yeghiazaryan, Mol Vis 2009; 15:2339-2348.