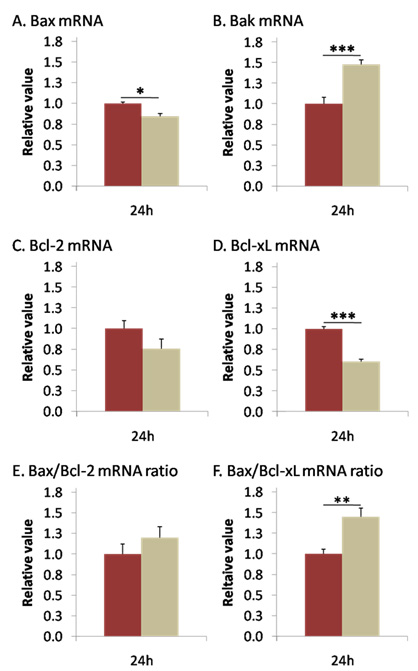
Figure 3. mRNA levels of
Bak increased and
Bcl-xL decreased 24 h after I/R.
Bax (
A),
Bak (
B),
Bcl-2 (
C), and
Bcl-xL (
D) mRNAs expression was measured by qPCR 24 h after reperfusion. Twenty-four h after reperfusion, ischemia induced a slight
decrease in
Bax (
A), and strongly increase
Bak (
B) mRNA expression. Anti-apoptotic
Bcl-2 expression (
C) was not modified, but
Bcl-xL (
D) was strongly reduced 24 h after I/R.
Figure 1 E,F revealed no modification in
Bax:
Bcl-2 and a highly significant increase in
Bax:
Bcl-xL mRNAs ratio 24 h after I/R. Brown columns denote control retinas (n=6), and beige columns denote ischemic retinas (n=10).
Error bars represent SEM, where *p<0.05, **p<0.005, ***p<0.001 in control versus ischemic retinas as measured by Student's
t-test.
 Figure 3 of
Produit-Zengaffinen, Mol Vis 2009; 15:2101-2110.
Figure 3 of
Produit-Zengaffinen, Mol Vis 2009; 15:2101-2110.