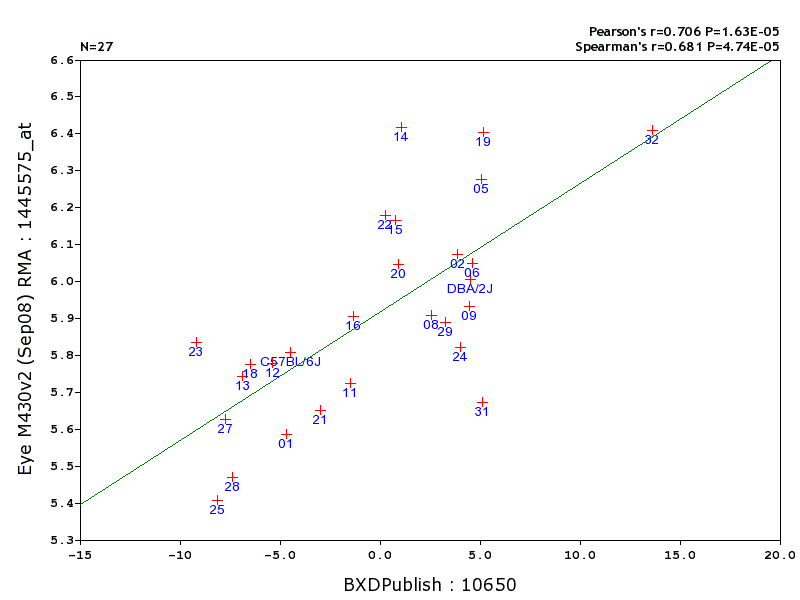
Figure 9. Retinal ganglion cells
correlation with
Fbxl20. x-axis units are in 1000s relative to
the mean value of about 58,000 cells. y-axis units are log2 signal
intensity.
Fbxl20 is physically linked to the
Nnc1
locus on Chr 11. Despite the strong genetic and statistical
association, this gene is unlikely to cause variation in cell number
(see text). The effect is likely to be due to linkage disequilibrium.
How to generate a correlation
graph between a probe set and a phenotype: Step 1. With the
descriptors set as “Choose Species=Mouse, Group=BXD, Type=Eye mRNA,
Database=Eye M430v2 (Sep08) RMA,” search the ANY search box for the
gene
Fbxl20 (1445575_at). Place a check in the box by the
1445575_at probe and click the Add to Collection button. Step 2. Return
to the search page and change “Type” to Phenotypes, and “Database” to
BXD Published Phenotypes. In the ANY box, search “Retinal Ganglion Cell
Number” or 10650. Place a check in the box next to “recordID/10650 –
Retinal Ganglion cell number” and click '
Add to Collection'
button. Step 3. Follow the instructions from
Figure 6 to arrive at the
correlation scatter plot shown.
 Figure 9 of Geisert, Mol Vis 2009; 15:1730-1763.