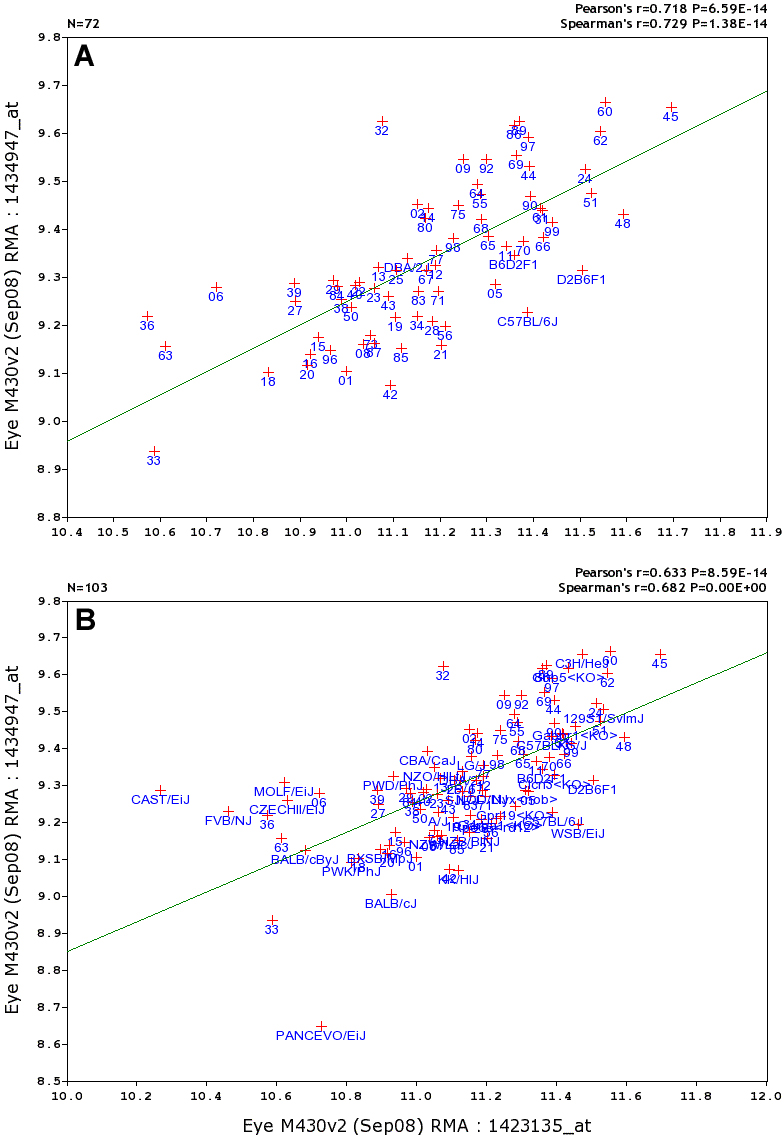
Figure 6. Correlation scatter plots for retinal ganglion cell markers. Pearson and Spearman correlations are listed in the top right
corner, along with p values.
A provides the correlation using only the BXD family strains (n=72), whereas
B provides data for the full set of 103 types of mice. How to compute correlations between two genes, such as
Thy1 and
Kif3c: Step 1. Link to
GeneNetwork and search for probe sets 1423135_at and 1434947_at in the ANY field (or search for
Thy1 and
Kif3c rather than the specific probe set). Step 2. Click the check boxes to the left of each entry and click the '
Add to Collection' button.
GeneNetwork will place probe sets in a BXD Trait Collection window. You can add many of other traits to this window, but they must all
be traits associated with the BXD group of mouse strains. Step 3. Select the check boxes again in the BXD Trait Collection
window, and then click the '
Correlation Matrix' button. This computes both Pearson and Spearman correlations and places them in a 2×2 correlation matrix. (You can make
a correlation matrix with up to 100 entries.) All of the values in this 2×2 matrix are linked to scatter plots. Step 4. Click
on the lower-left square (it should read 0.718 n=72). This will open a scatter plot of the coexpression of the two probe sets,
panel
A. A simple alternative method will give you the plot shown in panel
B. Search for the
Thy1 as in step 1, then click on the entry text itself rather than the check box. This will open the Trait Data and Analysis Form
for
Thy1 (see the
Gpnmb example in
Figure 4). Find the button labeled '
Trait Correlations' and select it, leaving the other settings (Choose Database, Calculate, Case, and Return) in their default settings. A Correlation
Table will automatically open with a list of the top 500 correlates of
Thy1 based on the variation across all 103 types of mice. Item 9 on this list of 500 transcripts is the
Kif3c probe set 1434947_at. Finally, click on the blue correlation value in the
Kif3c row (row 9) to regenerate panel
B. Review each column of data and note that the list of 500 can be resorted using the small up and down arrowheads at the top
of each column.
 Figure 6 of
Geisert, Mol Vis 2009; 15:1730-1763.
Figure 6 of
Geisert, Mol Vis 2009; 15:1730-1763.